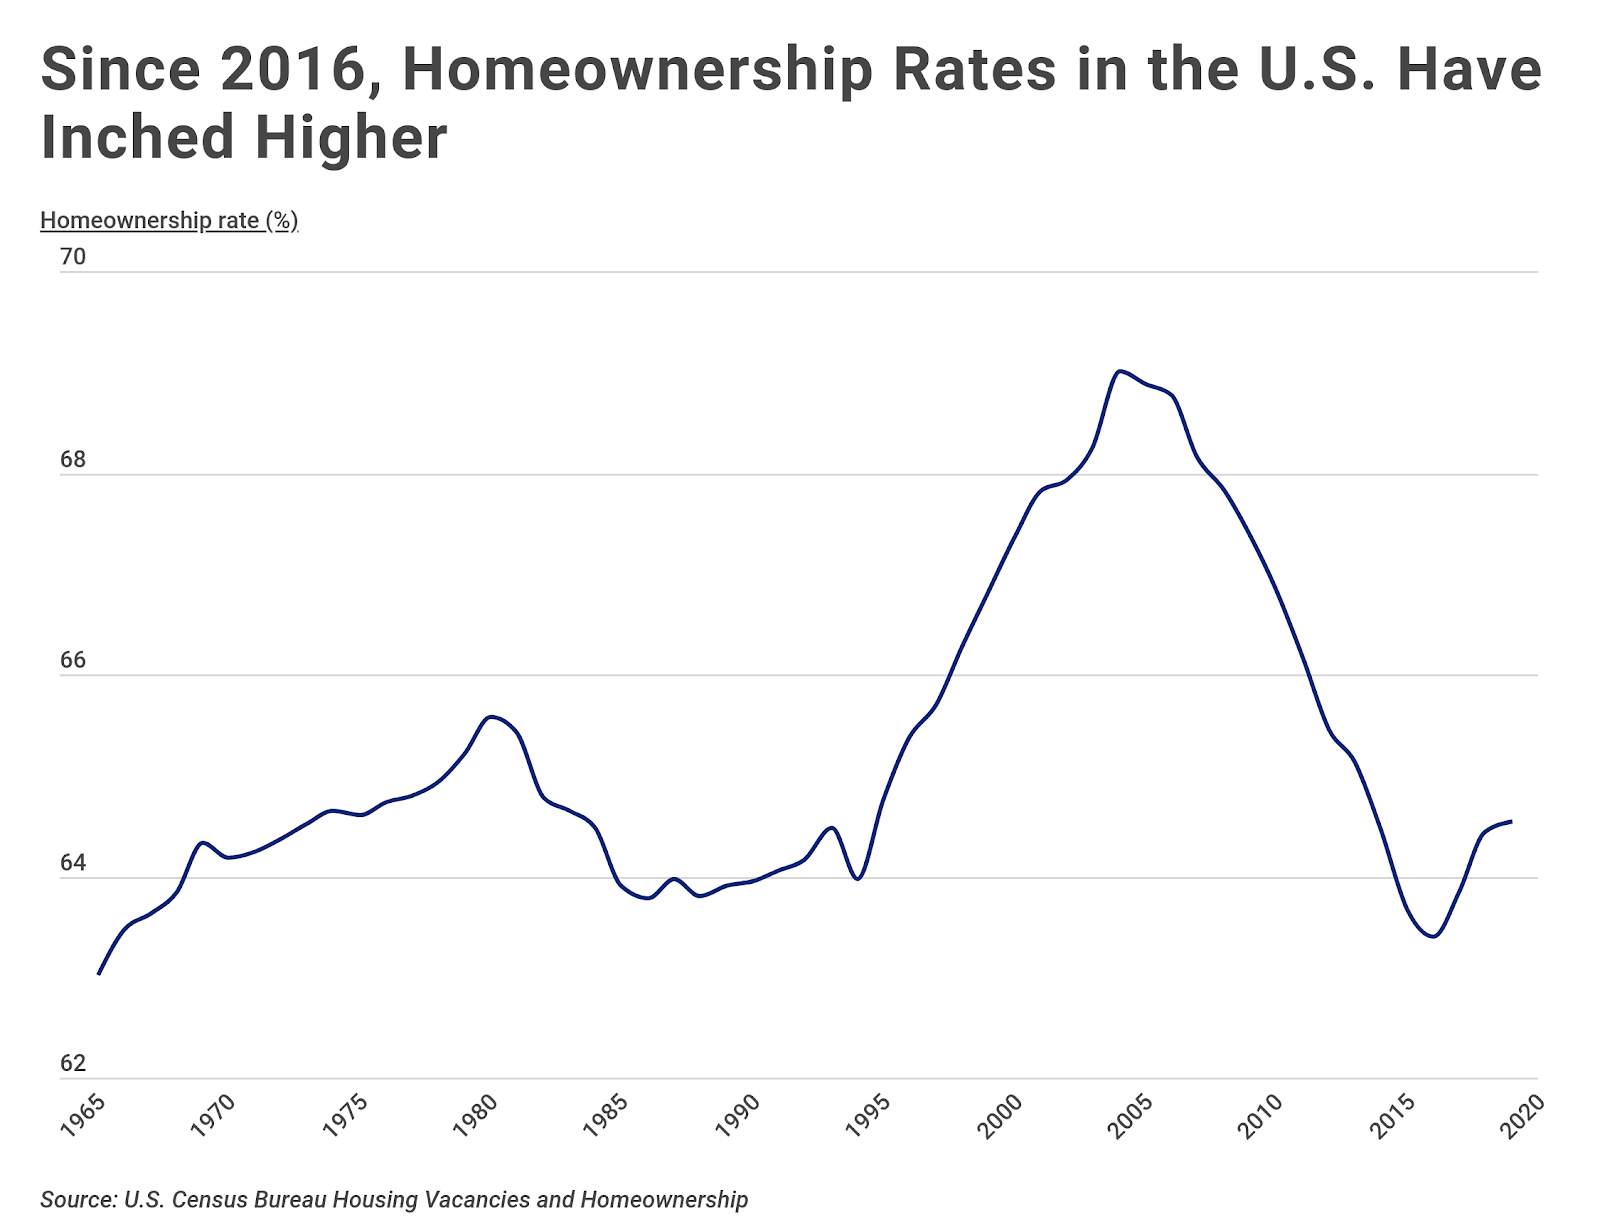
Owning a home has long been a cornerstone of the American Dream. However, this dream remains out of reach for many Americans. According to the U.S. Census Bureau, only 64.6 percent of Americans owned a home in 2019. That’s 4.3 percentage points below the peak in 2005. While homeownership rates in the U.S. have picked up in recent years, homeownership has not recovered from its pre-recession levels, and growing concerns around COVID-19’s impact on the economy suggest those levels won’t be retaken any time soon.
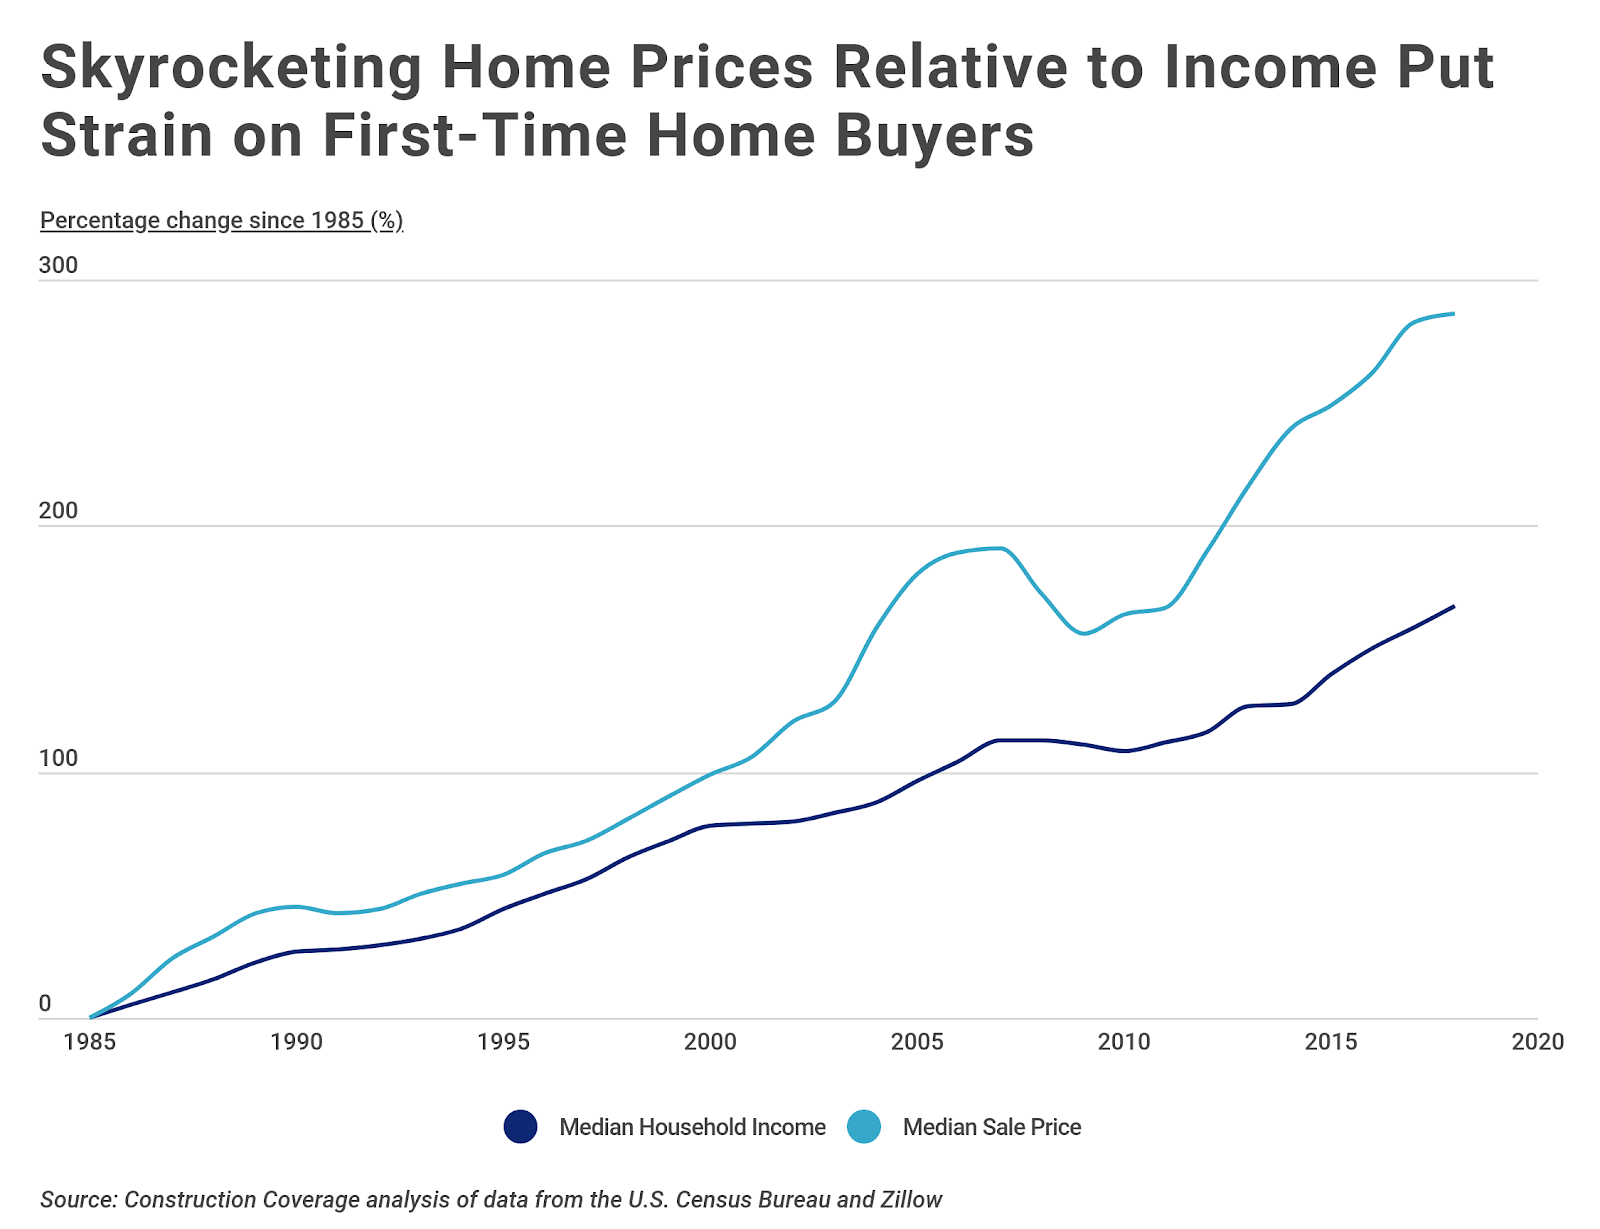
For the past few decades, home price growth has far exceeded wage growth, making it especially challenging for first-time buyers to afford a home. In 2018, the median household income was $63,179, representing a 168 percent increase since 1985. By contrast, in 2018 the median sales price for a home was $325,275, a 286 percent increase over the same time period. Further, the gap between home price growth and wage growth has accelerated significantly since 2010.
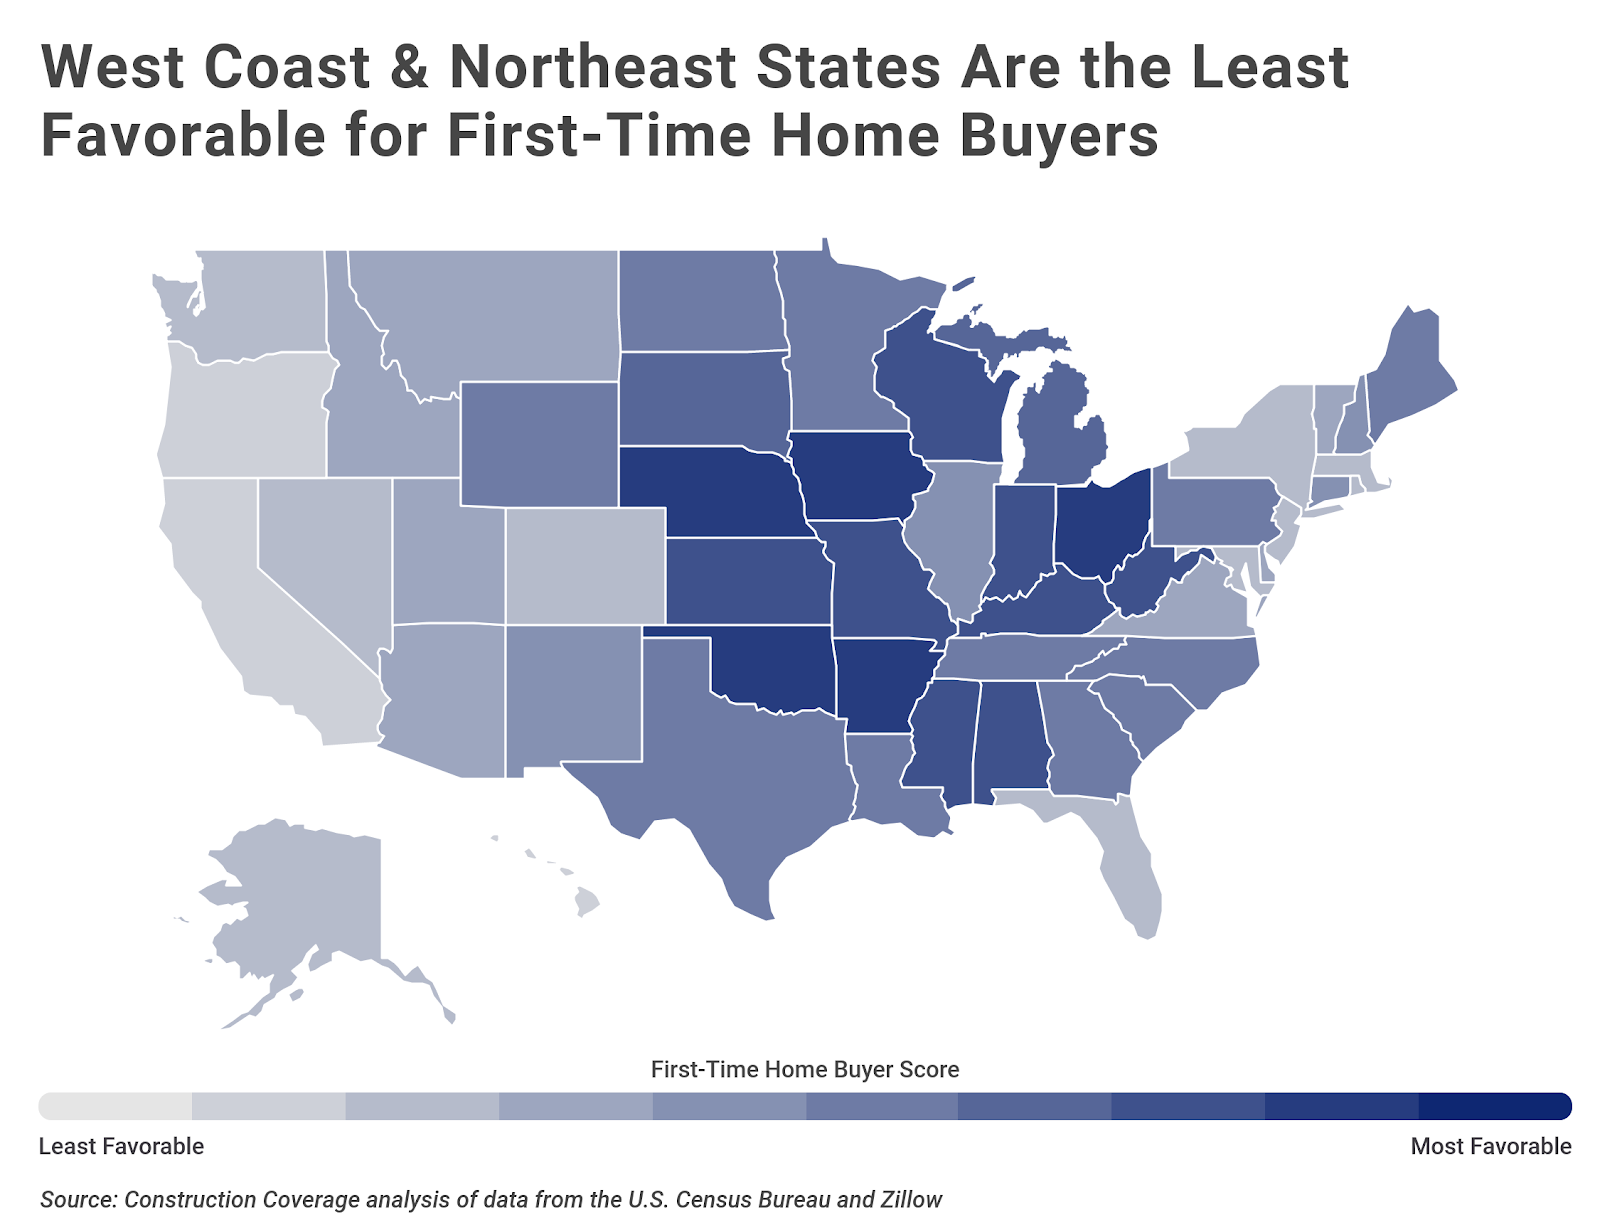
When factoring in affordability, cost of living, employment opportunities, and forecasted home value growth, the toughest locations for young buyers are on the West Coast and in the Northeast. States such as California, Hawaii, and Massachusetts tend to have high living costs and home prices that far exceed any income premium that these states offer. On the other hand, areas in the Midwest and South, like Oklahoma and Ohio, offer more affordable opportunities for new families.
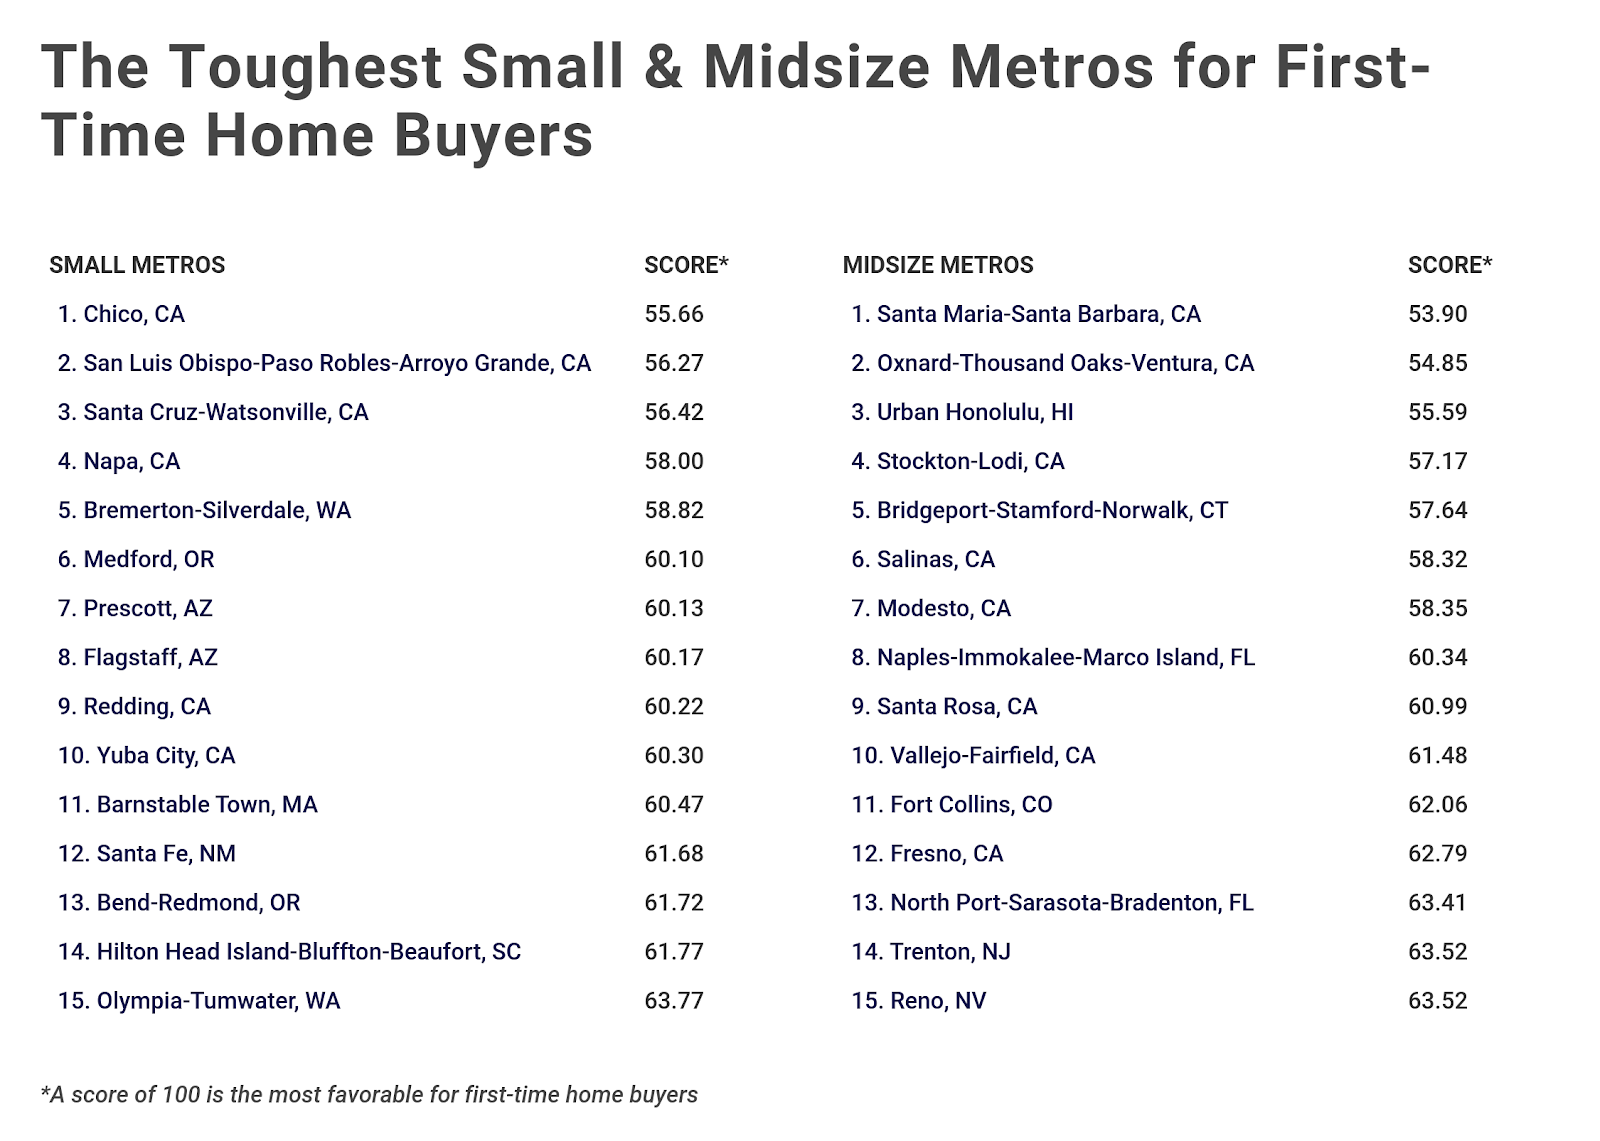
To identify the toughest metro areas for first-time home buyers, researchers at Construction Coverage, a review site for construction and commercial insurance, analyzed data from Zillow and the U.S. Census Bureau. They created a ranking based on factors such as home affordability (median millennial earnings as a share of home prices), unemployment among millennials, cost of living, and projected home value growth. Additionally, metros were grouped into the following categories to improve relevance:
Large metros: 1,000,000 residents or more
Midsize metros: 350,000-999,999 residents
Small metros: less than 350,000 residents
A disproportionate share of the toughest cities are located in California, while many of the others are located in the Northeast or the Pacific Northwest.
The Toughest Large Cities for First-Time Home Buyers
Photo Credit: Alamy Stock Photo
15. Denver-Aurora-Lakewood, CO
Overall score: 63.41 / 100
Median home price: $437,537
Median earnings for full-time millennial workers: $45,600
Estimated monthly mortgage payment: $1,753
Forecasted 1-year change in home price: 4.2%
Unemployment among millennials: 3.7%
Cost of living (compared to national average): +6.3%
Photo Credit: Alamy Stock Photo
14. Seattle-Tacoma-Bellevue, WA
Overall score: 63.00 / 100
Median home price: $531,353
Median earnings for full-time millennial workers: $52,000
Estimated monthly mortgage payment: $2,128
Forecasted 1-year change in home price: 4.7%
Unemployment among millennials: 3.9%
Cost of living (compared to national average): +11.8%
Photo Credit: Alamy Stock Photo
13. Providence-Warwick, RI-MA
Overall score: 62.96 / 100
Median home price: $315,970
Median earnings for full-time millennial workers: $41,000
Estimated monthly mortgage payment: $1,266
Forecasted 1-year change in home price: 4.0%
Unemployment among millennials: 6.1%
Cost of living (compared to national average): -0.3%
Photo Credit: Alamy Stock Photo
12. Boston-Cambridge-Newton, MA-NH
Overall score: 62.31 / 100
Median home price: $490,327
Median earnings for full-time millennial workers: $55,000
Estimated monthly mortgage payment: $1,964
Forecasted 1-year change in home price: 3.9%
Unemployment among millennials: 4.1%
Cost of living (compared to national average): +11.8%
Photo Credit: Alamy Stock Photo
11. Las Vegas-Henderson-Paradise, NV
Overall score: 62.06 / 100
Median home price: $290,420
Median earnings for full-time millennial workers: $36,000
Estimated monthly mortgage payment: $1,163
Forecasted 1-year change in home price: 3.7%
Unemployment among millennials: 5.8%
Cost of living (compared to national average): -2.5%
Photo Credit: Alamy Stock Photo
10. Washington-Arlington-Alexandria, DC-VA-MD-WV
Overall score: 61.78 / 100
Median home price: $434,156
Median earnings for full-time millennial workers: $55,000
Estimated monthly mortgage payment: $1,739
Forecasted 1-year change in home price: 3.7%
Unemployment among millennials: 5.2%
Cost of living (compared to national average): +18.4%
Photo Credit: Alamy Stock Photo
9. Portland-Vancouver-Hillsboro, OR-WA
Overall score: 60.77 / 100
Median home price: $418,051
Median earnings for full-time millennial workers: $42,200
Estimated monthly mortgage payment: $1,675
Forecasted 1-year change in home price: 3.6%
Unemployment among millennials: 4.4%
Cost of living (compared to national average): +1.7%
Photo Credit: Alamy Stock Photo
8. Sacramento–Roseville–Arden-Arcade, CA
Overall score: 60.68 / 100
Median home price: $427,699
Median earnings for full-time millennial workers: $42,000
Estimated monthly mortgage payment: $1,713
Forecasted 1-year change in home price: 4.4%
Unemployment among millennials: 5.5%
Cost of living (compared to national average): +2.0%
Photo Credit: Alamy Stock Photo
7. San Jose-Sunnyvale-Santa Clara, CA
Overall score: 60.31 / 100
Median home price: $1,194,002
Median earnings for full-time millennial workers: $71,000
Estimated monthly mortgage payment: $4,783
Forecasted 1-year change in home price: 4.9%
Unemployment among millennials: 4.3%
Cost of living (compared to national average): +30.9%
Photo Credit: Alamy Stock Photo
6. San Francisco-Oakland-Hayward, CA
Overall score: 60.07 / 100
Median home price: $1,094,095
Median earnings for full-time millennial workers: $65,000
Estimated monthly mortgage payment: $4,383
Forecasted 1-year change in home price: 4.6%
Unemployment among millennials: 4.0%
Cost of living (compared to national average): +28.0%
Photo Credit: Alamy Stock Photo
5. Miami-Fort Lauderdale-West Palm Beach, FL
Overall score: 59.54 / 100
Median home price: $299,657
Median earnings for full-time millennial workers: $35,000
Estimated monthly mortgage payment: $1,200
Forecasted 1-year change in home price: 3.6%
Unemployment among millennials: 5.9%
Cost of living (compared to national average): +8.4%
Photo Credit: Alamy Stock Photo
4. San Diego-Carlsbad, CA
Overall score: 59.13 / 100
Median home price: $606,086
Median earnings for full-time millennial workers: $42,000
Estimated monthly mortgage payment: $2,428
Forecasted 1-year change in home price: 4.9%
Unemployment among millennials: 5.7%
Cost of living (compared to national average): +16.0%
Photo Credit: Alamy Stock Photo
3. New York-Newark-Jersey City, NY-NJ-PA
Overall score: 58.07 / 100
Median home price: $481,486
Median earnings for full-time millennial workers: $50,000
Estimated monthly mortgage payment: $1,929
Forecasted 1-year change in home price: 3.4%
Unemployment among millennials: 5.3%
Cost of living (compared to national average): +22.3%
Photo Credit: Alamy Stock Photo
2. Los Angeles-Long Beach-Anaheim, CA
Overall score: 56.86 / 100
Median home price: $674,786
Median earnings for full-time millennial workers: $40,000
Estimated monthly mortgage payment: $2,703
Forecasted 1-year change in home price: 4.3%
Unemployment among millennials: 5.7%
Cost of living (compared to national average): +17.1%
Photo Credit: Alamy Stock Photo
1. Riverside-San Bernardino-Ontario, CA
Overall score: 55.34 / 100
Median home price: $382,754
Median earnings for full-time millennial workers: $36,000
Estimated monthly mortgage payment: $1,533
Forecasted 1-year change in home price: 3.6%
Unemployment among millennials: 7.2%
Cost of living (compared to national average): +7.2%
Methodology & Detailed Findings
To find the toughest cities for first-time home buyers, Construction Coverage created a composite score for each location based on the following factors:
Home affordability (median millennial earnings as a share of home prices): 60%
Unemployment among millennials: 15%
Cost of living: 15%
Projected home value growth: 10%
Higher scores (closer to 100) represent more favorable conditions for first-time buyers; whereas, lower scores represent more challenging circumstances.
The current and projected home price data used in the analysis are from the Zillow Home Price Index. The estimated monthly mortgage payment is based on the Zillow Home Price Index and assumes a 30-year fixed mortgage, 20 percent down payment, and 4.4 percent interest rate.
Median earnings for full-time millennials and the unemployment rate among millennials were calculated using the U.S. Census Bureau’s 2018 American Community Survey 1-Year Public Use Microdata Sample. For this calculation, full-time workers are defined as those working 35 hours or more each week for at least 50 weeks that year. Millennials are those individuals between 22 and 37 years old in 2018.
Only metropolitan areas with at least 100,000 residents and data from Zillow were included. Additionally, metros were grouped into cohorts based on population size: large metros (1,000,000 residents or more), midsize metros (350,000-999,999 residents), and small metros (less than 350,000 residents).
At 38 percent, millennials represent the largest percentage of new home buyers. However, members of this generation are still more likely to be renters when compared to previous generations at the same age. Some of the reasons for millennials’ low homeownership rates include depressed earnings that stemmed from the Great Recession, high student loan debt, and the decision to delay major life events like marriage.
In large metropolitan areas, the gap between wages and home prices is another major factor in low homeownership rates among young buyers. For example, in San Francisco and San Jose, the median home price exceeds $1 million, more than four times the national median home price of $245,193. Additionally, in four of the toughest large cities for first-time buyers (Riverside, Los Angeles, Miami, and Las Vegas), the median earnings for full-time millennial workers is at or below the national median of $40,000.
However, there is still some optimism for change. As older millennials start settling into families and younger millennials start their post-college jobs, the combination of career progression and dual-income households could make homeownership for this generation more tenable in the future.

 Photo Credit: Alamy Stock Photo