While lockdowns during the COVID-19 pandemic have brought about a host of issues, there have been several positive outcomes. In addition to limiting the spread of the virus, the lockdowns have resulted in better air quality due to decreased commercial activity and automobile traffic. However, the lifting of lockdowns and a recent surge of wildfires in Western and Mountain states has quickly reversed this trend, once again exposing millions of Americans to poor air quality.
According to data from the Environmental Protection Agency (EPA), prior to COVID-19, nearly one in four Americans resided in counties with poor air quality. While ozone-related pollutants are the most common cause of poor air quality, many Americans are also exposed to a variety of other common pollutants such as particle pollutants, sulfur dioxide, and lead.
While a large number of Americans are still living in places with unhealthy levels of air pollution, conditions have been improving in recent decades. Through EPA efforts and the passage of the Clean Air Act, the U.S. has seen gradual improvement in air quality and a decline in the emissions of common pollutants since 1970. CO2 emissions have also shown small declines since 2010. Such improvements have occurred even with steady increases in the gross domestic product, travel, total population, and energy consumption.
Still, air quality in many areas, especially in the Western U.S., does not meet national standards. In addition to causing environmental issues, poor air quality can have negative consequences for individual health, which can be particularly detrimental to those already suffering from certain health problems such as asthma and cardiovascular disease. Additionally, new research indicates that economically disadvantaged communities are more likely to face higher levels of pollution. Furthermore, while the US has improved as a whole, the most polluted areas from 1980 are still among the most polluted today.
To identify metropolitan areas with the worst (and best) air quality, researchers from Filterbuy analyzed median Air Quality Index (AQI) values for 2019. These values, published annually by the EPA, are a measure of an area’s air pollution. Higher AQI values indicate that an area experiences higher pollution levels and lower air quality.
For the purpose of this report, only metropolitan areas with at least 500,000 residents were included. Here are the metropolitan areas with the worst (and best) air quality in the nation.
Metros With the Worst Air Quality
Photo Credit: Alamy Stock Photo
1. Riverside-San Bernardino-Ontario, CA
Median Air Quality Index for 2019: 89
Good days: 42
Moderate days: 178
Unhealthy or hazardous days: 145
Maximum Air Quality Index observed in 2019: 213
Population: 4,622,361
Photo Credit: Alamy Stock Photo
2. Phoenix-Mesa-Scottsdale, AZ
Median Air Quality Index for 2019: 74
Good days: 50
Moderate days: 261
Unhealthy or hazardous days: 54
Maximum Air Quality Index observed in 2019: 886
Population: 4,857,962
Photo Credit: Alamy Stock Photo
3. Los Angeles-Long Beach-Anaheim, CA
Median Air Quality Index for 2019: 72
Good days: 66
Moderate days: 208
Unhealthy or hazardous days: 91
Maximum Air Quality Index observed in 2019: 201
Population: 13,291,486
Photo Credit: Alamy Stock Photo
4. Bakersfield, CA
Median Air Quality Index for 2019: 67
Good days: 119
Moderate days: 151
Unhealthy or hazardous days: 95
Maximum Air Quality Index observed in 2019: 548
Population: 896,764
Photo Credit: Alamy Stock Photo
5. San Diego-Carlsbad, CA
Median Air Quality Index for 2019: 64
Good days: 87
Moderate days: 253
Unhealthy or hazardous days: 25
Maximum Air Quality Index observed in 2019: 169
Population: 3,343,364
Photo Credit: Alamy Stock Photo
6. Fresno, CA
Median Air Quality Index for 2019: 60
Good days: 139
Moderate days: 160
Unhealthy or hazardous days: 66
Maximum Air Quality Index observed in 2019: 187
Population: 994,400
Photo Credit: Alamy Stock Photo
7. Denver-Aurora-Lakewood, CO
Median Air Quality Index for 2019: 58
Good days: 91
Moderate days: 252
Unhealthy or hazardous days: 22
Maximum Air Quality Index observed in 2019: 154
Population: 2,932,415
Photo Credit: Alamy Stock Photo
8. Pittsburgh, PA
Median Air Quality Index for 2019: 56
Good days: 129
Moderate days: 220
Unhealthy or hazardous days: 16
Maximum Air Quality Index observed in 2019: 161
Population: 2,324,743
Photo Credit: Alamy Stock Photo
9. Detroit-Warren-Dearborn, MI
Median Air Quality Index for 2019: 56
Good days: 135
Moderate days: 217
Unhealthy or hazardous days: 13
Maximum Air Quality Index observed in 2019: 142
Population: 4,326,442
Photo Credit: Alamy Stock Photo
10. Chicago-Naperville-Elgin, IL-IN-WI
Median Air Quality Index for 2019: 55
Good days: 121
Moderate days: 227
Unhealthy or hazardous days: 17
Maximum Air Quality Index observed in 2019: 174
Population: 9,498,716
Metros With the Best Air Quality
Photo Credit: Alamy Stock Photo
1. Urban Honolulu, HI
Median Air Quality Index for 2019: 29
Good days: 339
Moderate days: 26
Unhealthy or hazardous days: 0
Maximum Air Quality Index observed in 2019: 94
Population: 980,080
Photo Credit: Alamy Stock Photo
2. Lakeland-Winter Haven, FL
Median Air Quality Index for 2019: 36
Good days: 314
Moderate days: 51
Unhealthy or hazardous days: 0
Maximum Air Quality Index observed in 2019: 100
Population: 708,009
Photo Credit: Alamy Stock Photo
3. Cape Coral-Fort Myers, FL
Median Air Quality Index for 2019: 36
Good days: 328
Moderate days: 36
Unhealthy or hazardous days: 1
Maximum Air Quality Index observed in 2019: 108
Population: 754,610
Photo Credit: Alamy Stock Photo
4. Syracuse, NY
Median Air Quality Index for 2019: 37
Good days: 337
Moderate days: 28
Unhealthy or hazardous days: 0
Maximum Air Quality Index observed in 2019: 77
Population: 650,502
Photo Credit: Alamy Stock Photo
5. Rochester, NY
Median Air Quality Index for 2019: 37
Good days: 317
Moderate days: 48
Unhealthy or hazardous days: 0
Maximum Air Quality Index observed in 2019: 90
Population: 1,071,082
Photo Credit: Alamy Stock Photo
6. Albany-Schenectady-Troy, NY
Median Air Quality Index for 2019: 37
Good days: 322
Moderate days: 43
Unhealthy or hazardous days: 0
Maximum Air Quality Index observed in 2019: 92
Population: 883,169
Photo Credit: Alamy Stock Photo
7. Scranton–Wilkes-Barre–Hazleton, PA
Median Air Quality Index for 2019: 38
Good days: 329
Moderate days: 36
Unhealthy or hazardous days: 0
Maximum Air Quality Index observed in 2019: 85
Population: 555,485
Photo Credit: Alamy Stock Photo
8. Grand Rapids-Wyoming, MI
Median Air Quality Index for 2019: 38
Good days: 298
Moderate days: 67
Unhealthy or hazardous days: 0
Maximum Air Quality Index observed in 2019: 100
Population: 1,069,405
Photo Credit: Alamy Stock Photo
9. Portland-Vancouver-Hillsboro, OR-WA
Median Air Quality Index for 2019: 38
Good days: 285
Moderate days: 77
Unhealthy or hazardous days: 3
Maximum Air Quality Index observed in 2019: 128
Population: 2,478,810
Photo Credit: Alamy Stock Photo
10. Madison, WI
Median Air Quality Index for 2019: 39
Good days: 285
Moderate days: 80
Unhealthy or hazardous days: 0
Maximum Air Quality Index observed in 2019: 93
Population: 660,422
Methodology & Detailed Findings
The data used in this analysis is from the EPA’s 2019 Air Quality Index Report. The Air Quality Index (AQI) is EPA’s method for reporting daily air quality by location based on National Ambient Air Quality Standards. Higher AQI values correspond to higher levels of pollution and worse air quality. AQI values below 50 are considered good; AQI values between 51 and 100 are considered moderate; and AQI values that exceed 100 are considered unhealthy (at first for sensitive groups and then for everyone as values increase).
To determine the locations with the worst air quality, metropolitan areas were ranked by their respective median AQI values, with high AQI values corresponding to worse air quality. In the event of a tie, the location with the higher maximum AQI value was considered to have worse air quality.

 Photo Credit: Alamy Stock Photo
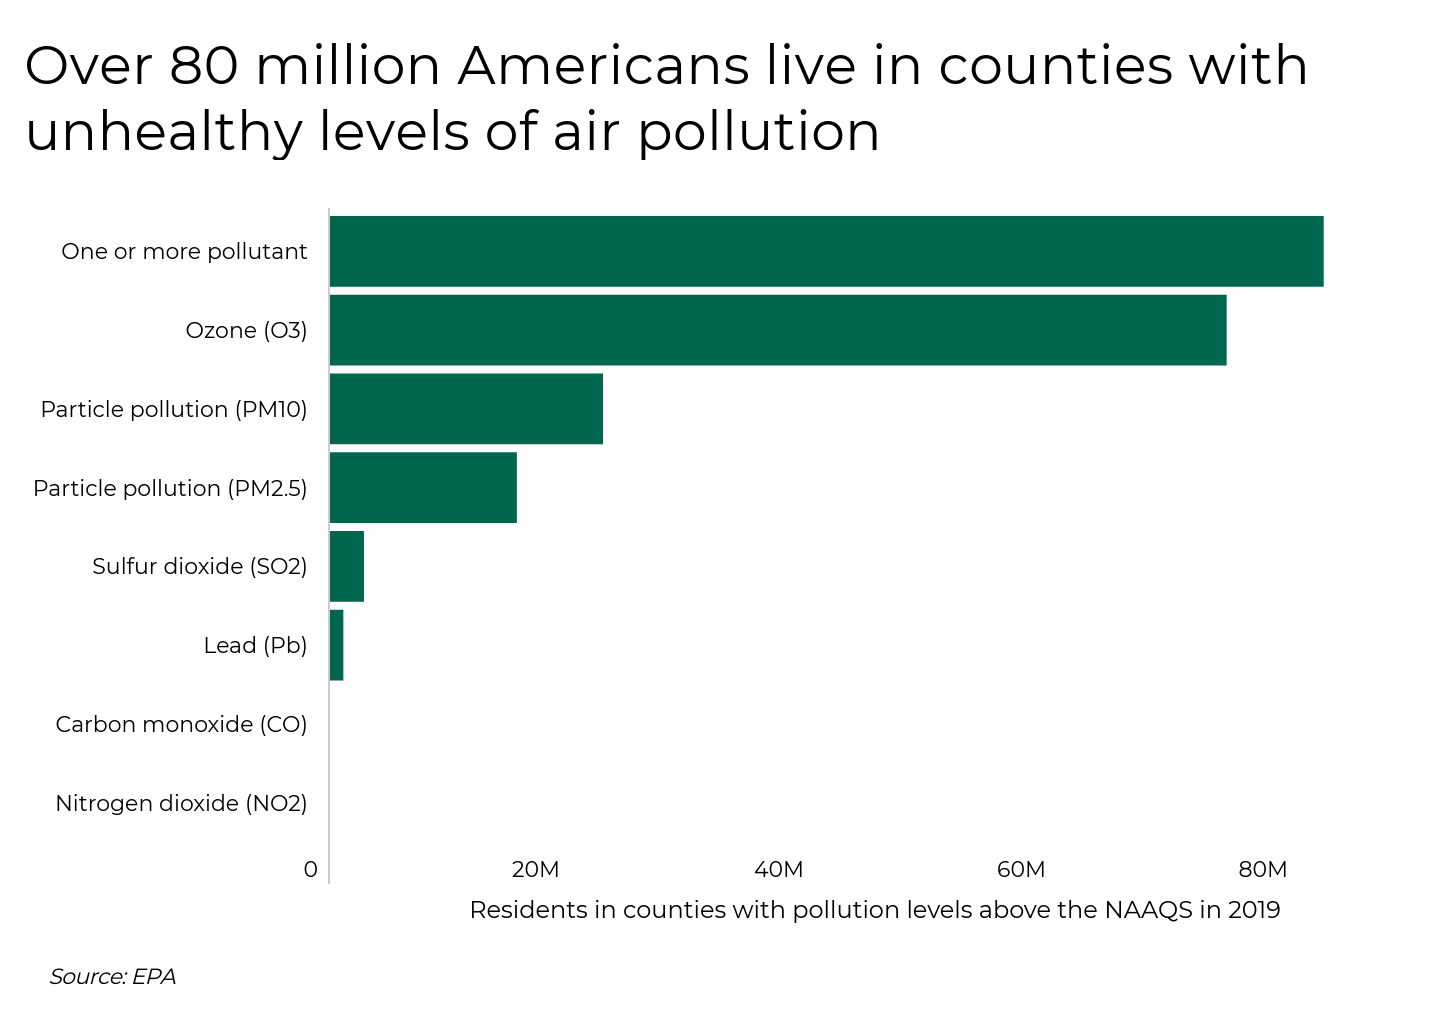
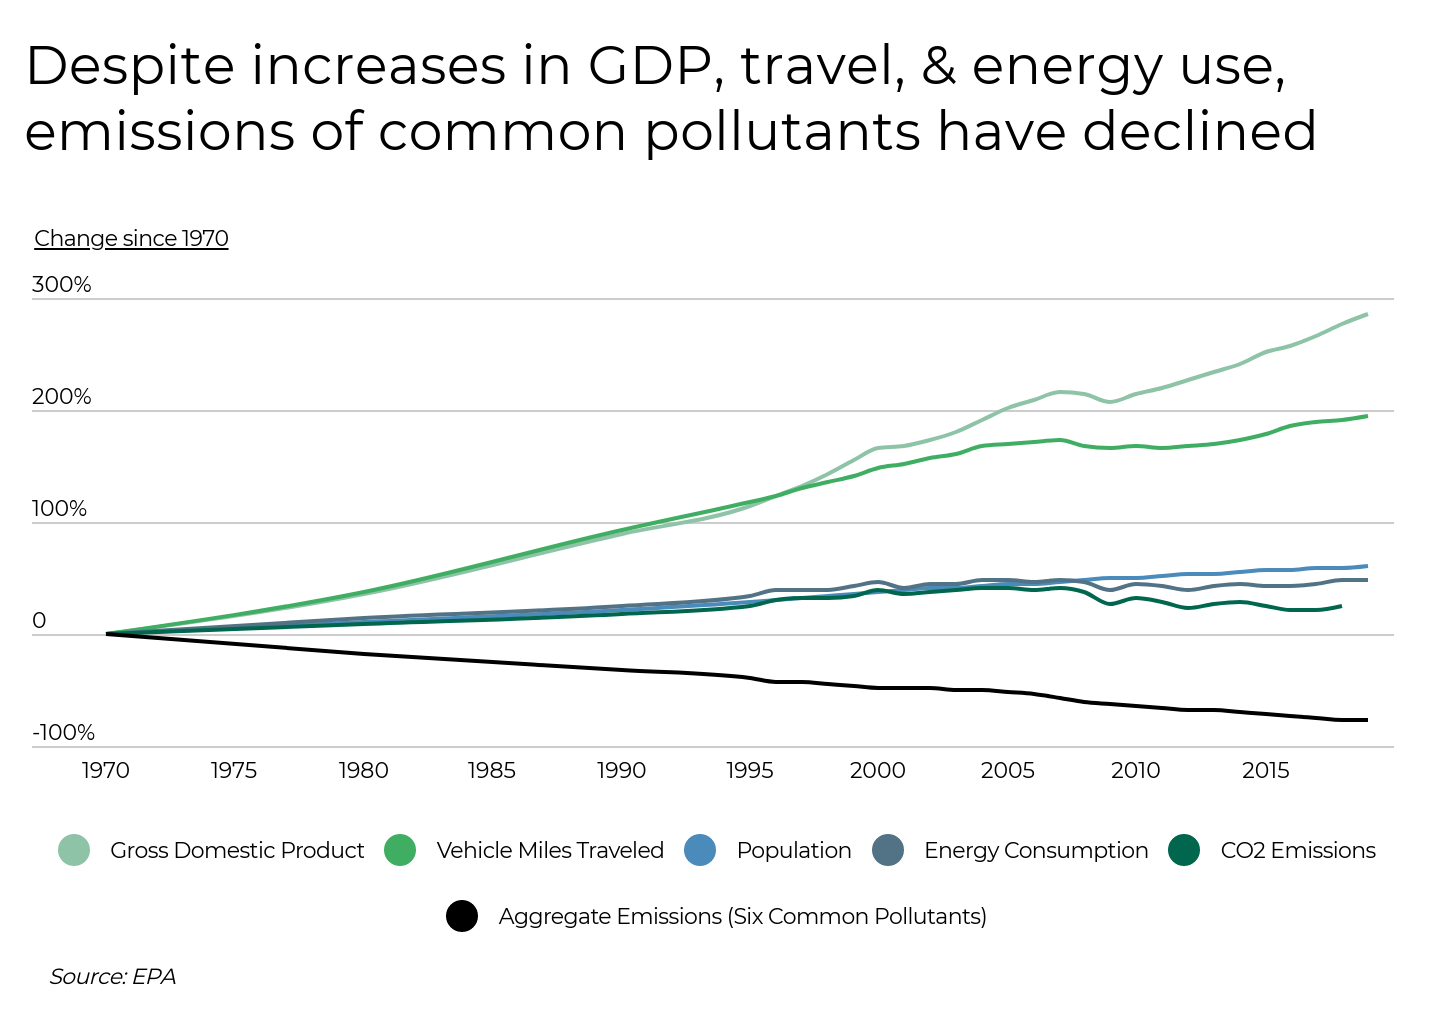
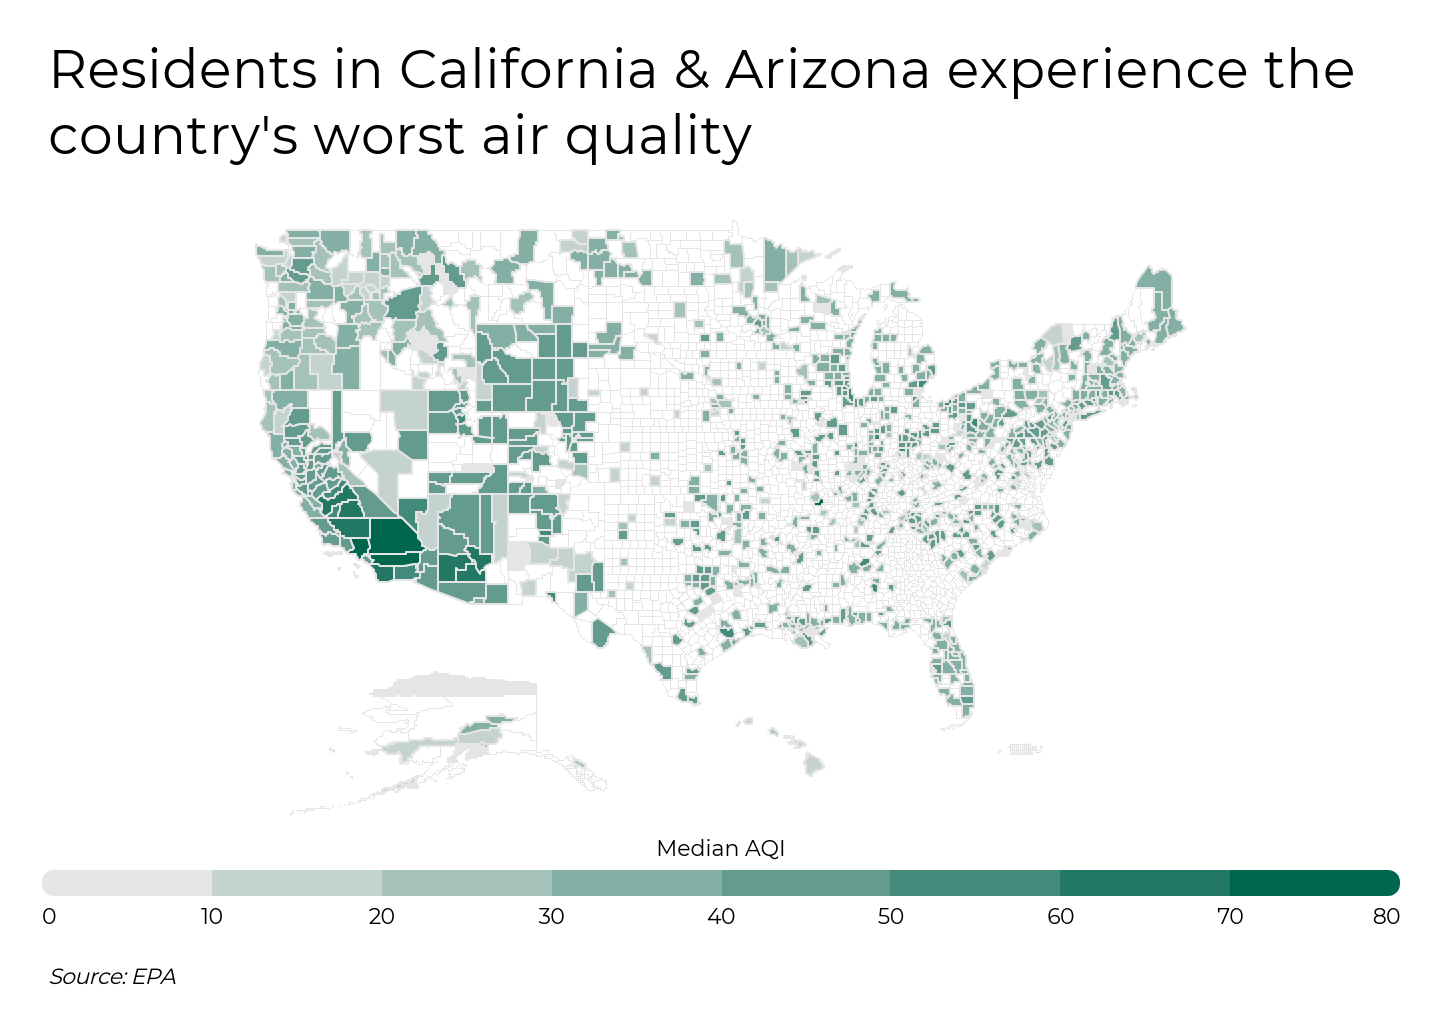
 Photo Credit: Alamy Stock Photo