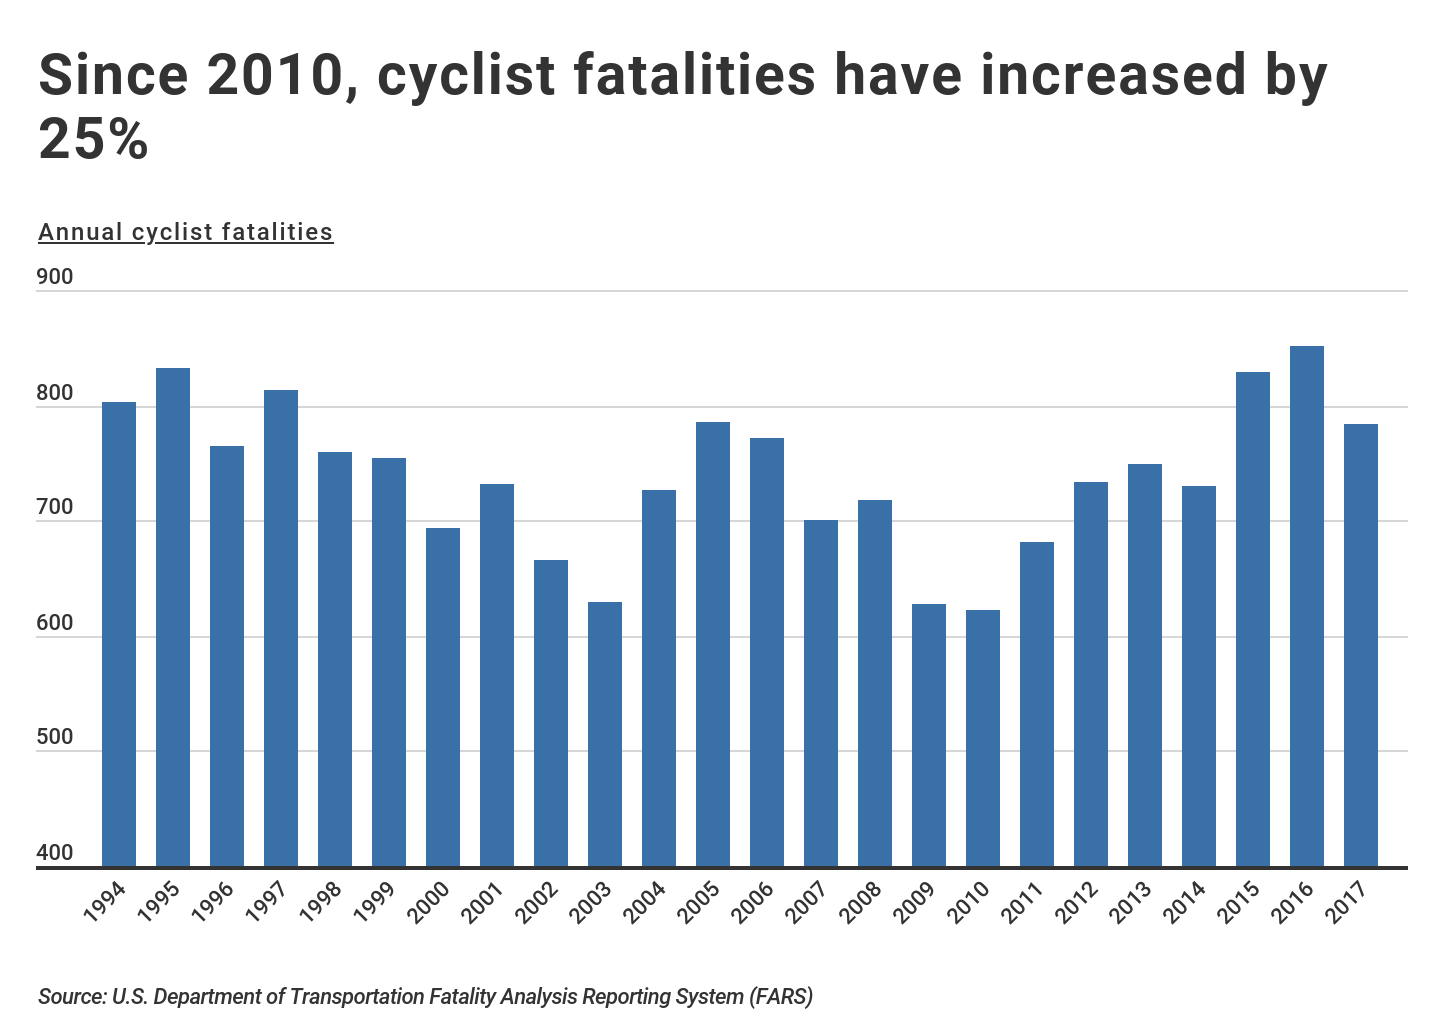
Commuters looking to reduce their environmental footprint may want to think twice about safety before hopping on a bike. According to the National Highway Traffic Safety Administration, the number of cyclist deaths has been rapidly increasing over the past several years. In 2017 alone, there were 783 cyclist fatalities nationwide, a 25 percent increase since 2010.
Increases in cyclist fatalities have occurred alongside increases in bike share programs and the number of cyclists commuting to work. In 2017, there were nearly 800,000 commuters nationwide who rode their bicycles to work, representing 0.5 percent of all commuters. While the share of bike commuters has remained steady in recent years, the fatality rate per 100,000 bike commuters is at a ten-year high.
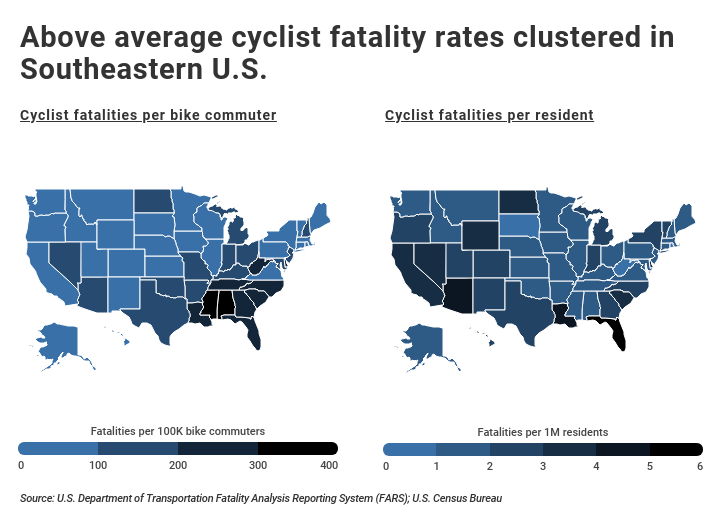
Although cyclist fatalities have been on the rise nationwide, the risk varies widely by location. Between 2014 and 2017, California, Florida, and Texas, were responsible for about 41 percent of all cyclist fatalities in the U.S., despite accounting for only 27 percent of the population. When comparing fatality rates (per commuter or per resident), the most dangerous areas are clustered in the Southeastern U.S. Despite warmer weather, these states also report below-average rates of bike commuters—possibly the result of dangerous riding conditions.
With the rise of bike share programs and an increased emphasis on more environmentally friendly modes of transportation, cycling is likely to continue growing in popularity, especially in major cities. To identify which cities are most dangerous for cyclists, researchers at CarInsurance.org analyzed fatality data from the National Highway Traffic Safety Administration’s Fatality Analysis Reporting System for the period 2014-2017, as well as population data from the U.S. Census Bureau’s American Community Survey. They ranked cities by the number of bike fatalities per 100,000 bike commuters. Only cities with at least one cyclist fatality per year and at least 100,000 residents were included in the analysis. Consistent with the findings at the state level, 13 of the 20 most dangerous cities for cyclists are in Florida, California, or Texas. Here’s the full list.
The 20 Most Dangerous Cities for Cyclists
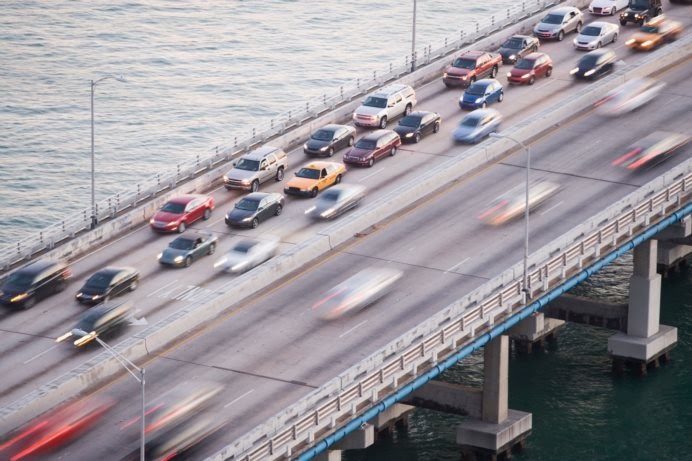
Photo Credit: Alamy Stock Photo
20. Miami, Florida
Annual bike fatalities per 100K commuters: 193
Annual bike fatalities per 1M residents: 9.0
Total bike fatalities (last 4 years): 16
Share of fatalities where cyclist wore a helmet: 0%
Number of bike commuters: 2,073
Population: 443,007
Photo Credit: Alamy Stock Photo
19. Phoenix, Arizona
Annual bike fatalities per 100K commuters: 201
Annual bike fatalities per 1M residents: 6.5
Total bike fatalities (last 4 years): 41
Share of fatalities where cyclist wore a helmet: 12%
Number of bike commuters: 5,090
Population: 1,574,421
Photo Credit: Alamy Stock Photo
18. Fort Lauderdale, Florida
Annual bike fatalities per 100K commuters: 204
Annual bike fatalities per 1M residents: 14.1
Total bike fatalities (last 4 years): 10
Share of fatalities where cyclist wore a helmet: 0%
Number of bike commuters: 1,225
Population: 177,175
Photo Credit: Alamy Stock Photo
17. Modesto, California
Annual bike fatalities per 100K commuters: 239
Annual bike fatalities per 1M residents: 4.8
Total bike fatalities (last 4 years): 4
Share of fatalities where cyclist wore a helmet: 0%
Number of bike commuters: 419
Population: 210,166
Photo Credit: Alamy Stock Photo
16. San Antonio, Texas
Annual bike fatalities per 100K commuters: 243
Annual bike fatalities per 1M residents: 2.2
Total bike fatalities (last 4 years): 13
Share of fatalities where cyclist wore a helmet: 8%
Number of bike commuters: 1,340
Population: 1,461,623
Photo Credit: Alamy Stock Photo
15. Oklahoma City, Oklahoma
Annual bike fatalities per 100K commuters: 250
Annual bike fatalities per 1M residents: 2.4
Total bike fatalities (last 4 years): 6
Share of fatalities where cyclist wore a helmet: 0%
Number of bike commuters: 601
Population: 629,191
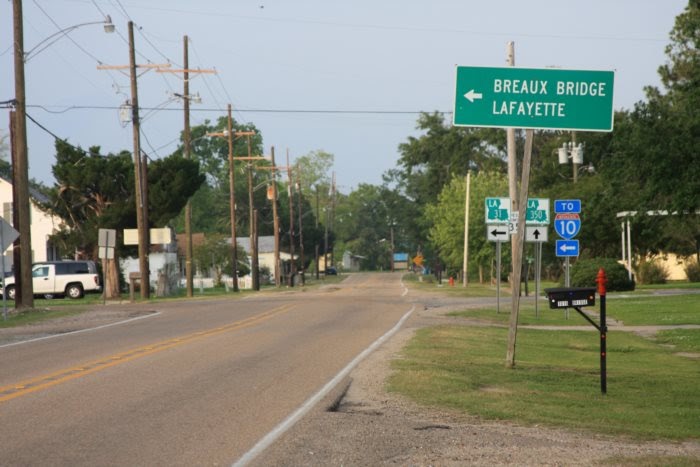
Photo Credit: Alamy Stock Photo
14. Lafayette, Louisiana
Annual bike fatalities per 100K commuters: 251
Annual bike fatalities per 1M residents: 13.8
Total bike fatalities (last 4 years): 7
Share of fatalities where cyclist wore a helmet: 0%
Number of bike commuters: 696
Population: 126,476
Photo Credit: Alamy Stock Photo
13. Arlington, Texas
Annual bike fatalities per 100K commuters: 262
Annual bike fatalities per 1M residents: 2.6
Total bike fatalities (last 4 years): 4
Share of fatalities where cyclist wore a helmet: 0%
Number of bike commuters: 382
Population: 388,225
Photo Credit: Alamy Stock Photo
12. Charlotte, North Carolina
Annual bike fatalities per 100K commuters: 267
Annual bike fatalities per 1M residents: 2.7
Total bike fatalities (last 4 years): 9
Share of fatalities where cyclist wore a helmet: 11%
Number of bike commuters: 843
Population: 826,060
Photo Credit: Alamy Stock Photo
11. Bakersfield, California
Annual bike fatalities per 100K commuters: 293
Annual bike fatalities per 1M residents: 6.0
Total bike fatalities (last 4 years): 9
Share of fatalities where cyclist wore a helmet: 0%
Number of bike commuters: 768
Population: 372,680
Photo Credit: Alamy Stock Photo
10. Lakeland, Florida
Annual bike fatalities per 100K commuters: 299
Annual bike fatalities per 1M residents: 9.6
Total bike fatalities (last 4 years): 4
Share of fatalities where cyclist wore a helmet: 25%
Number of bike commuters: 335
Population: 104,165
Photo Credit: Alamy Stock Photo
9. Memphis, Tennessee
Annual bike fatalities per 100K commuters: 309
Annual bike fatalities per 1M residents: 2.7
Total bike fatalities (last 4 years): 7
Share of fatalities where cyclist wore a helmet: 0%
Number of bike commuters: 567
Population: 654,723
Photo Credit: Alamy Stock Photo
8. Baton Rouge, Louisiana
Annual bike fatalities per 100K commuters: 319
Annual bike fatalities per 1M residents: 8.8
Total bike fatalities (last 4 years): 8
Share of fatalities where cyclist wore a helmet: 0%
Number of bike commuters: 627
Population: 227,549
Photo Credit: Alamy Stock Photo
7. Stockton, California
Annual bike fatalities per 100K commuters: 327
Annual bike fatalities per 1M residents: 7.4
Total bike fatalities (last 4 years): 9
Share of fatalities where cyclist wore a helmet: 0%
Number of bike commuters: 688
Population: 304,358
Photo Credit: Alamy Stock Photo
6. Chula Vista, California
Annual bike fatalities per 100K commuters: 358
Annual bike fatalities per 1M residents: 4.7
Total bike fatalities (last 4 years): 5
Share of fatalities where cyclist wore a helmet: 0%
Number of bike commuters: 349
Population: 264,101
Photo Credit: Alamy Stock Photo
5. Pompano Beach, Florida
Annual bike fatalities per 100K commuters: 417
Annual bike fatalities per 1M residents: 16.3
Total bike fatalities (last 4 years): 7
Share of fatalities where cyclist wore a helmet: 0%
Number of bike commuters: 420
Population: 107,542
Photo Credit: Alamy Stock Photo
4. Dayton, Ohio
Annual bike fatalities per 100K commuters: 459
Annual bike fatalities per 1M residents: 7.1
Total bike fatalities (last 4 years): 4
Share of fatalities where cyclist wore a helmet: 25%
Number of bike commuters: 218
Population: 140,939
Photo Credit: Alamy Stock Photo
3. San Bernardino, California
Annual bike fatalities per 100K commuters: 578
Annual bike fatalities per 1M residents: 8.1
Total bike fatalities (last 4 years): 7
Share of fatalities where cyclist wore a helmet: 14%
Number of bike commuters: 303
Population: 215,252
Photo Credit: Alamy Stock Photo
2. Abilene, Texas
Annual bike fatalities per 100K commuters: 1,116
Annual bike fatalities per 1M residents: 10.2
Total bike fatalities (last 4 years): 5
Share of fatalities where cyclist wore a helmet: 0%
Number of bike commuters: 112
Population: 122,762
Photo Credit: Alamy Stock Photo
1. Cape Coral, Florida
Annual bike fatalities per 100K commuters: 1,333
Annual bike fatalities per 1M residents: 5.8
Total bike fatalities (last 4 years): 4
Share of fatalities where cyclist wore a helmet: 0%
Number of bike commuters: 75
Population: 173,679
Methodology & Detailed Findings
Cyclist fatality statistics were obtained from the National Highway Traffic Safety Administration’s Fatality Analysis Reporting System for the period 2014-2017. Population statistics, including total city population and age distribution, as well as cyclist commuting rates, were obtained from the U.S. Census Bureau’s American Community Survey.
The cities in this analysis were ranked according to the cyclist fatality rate. Cyclist fatality rates were calculated as the average number of cyclist fatalities in the city for the period 2014-2017 per 100,000 estimated cycling commuters in 2017. All cities included in the final list had a population of at least 100,000, as well as at least one cyclist death per year.
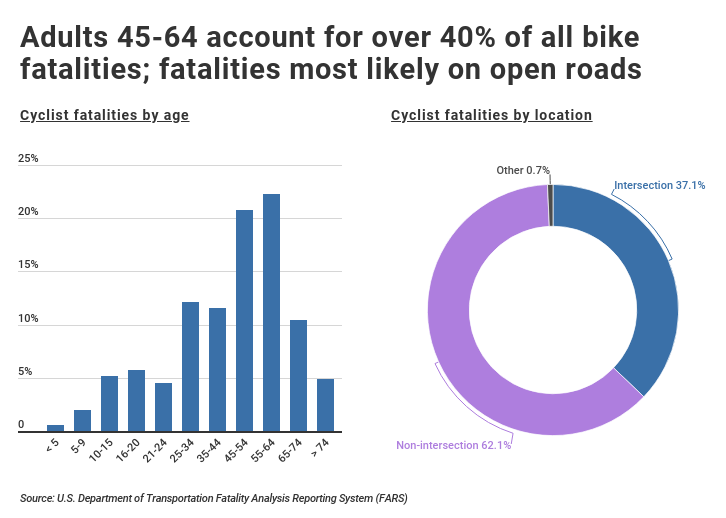
A closer look at the data yields additional insights into fatal cycling accidents. For example, adults over 45 are more likely to be involved in a fatal bicycling accident than younger people. More specifically, nearly 60 percent of cycling fatalities between 2014-2017 involved victims over the age of 45.
Furthermore, more than 60 percent of fatal bike accidents occur outside of intersections on open roads. In 38 percent of fatal bike accidents, the motorist was at fault. By contrast, the cyclist was deemed to be at fault only 31 percent of the time. In the remaining cases, fault was unknown or not reported.
Despite rising cyclist fatality rates, there are many things that can be done at the individual level to improve cycling safety. According to NHTSA, bike helmets can reduce the risk of head injury by 85 percent. Interestingly, only about 16 percent of cyclists involved in fatal accidents were known to be wearing helmets. For cyclists, wearing a helmet and adhering to traffic rules (such as riding in the same direction as cars) can reduce the risk of collision or fatal injury. In addition, reducing distractions such as texting can make cycling a safer mode of transportation.