COVID-19 has radically changed the norms of the American workforce. Unprecedented job losses, shuttered businesses, and stay-at-home orders have affected workers across all industries and job functions. One of the most notable changes during COVID-19 has been the adoption of remote work—a trend that will undoubtedly impact the future of many American cities.
According to data collected from the Federal Reserve in April of 2020, more than half of all workers were performing at least some of their work from home, and 41 percent were completing all of their work at home. These figures stand in stark contrast to those collected in October of 2019, which indicated that only 7 percent of non-self-employed workers usually worked from home.
This mass transition to remote work in the wake of coronavirus is reinforcing a trend that has been gaining momentum in recent years—namely, many people fleeing expensive cities in favor of more affordable locations. Now, with many companies, including tech giants like Twitter and Facebook, announcing that they will allow employees to work from home permanently, the migration trend toward more affordable locations is likely to accelerate.
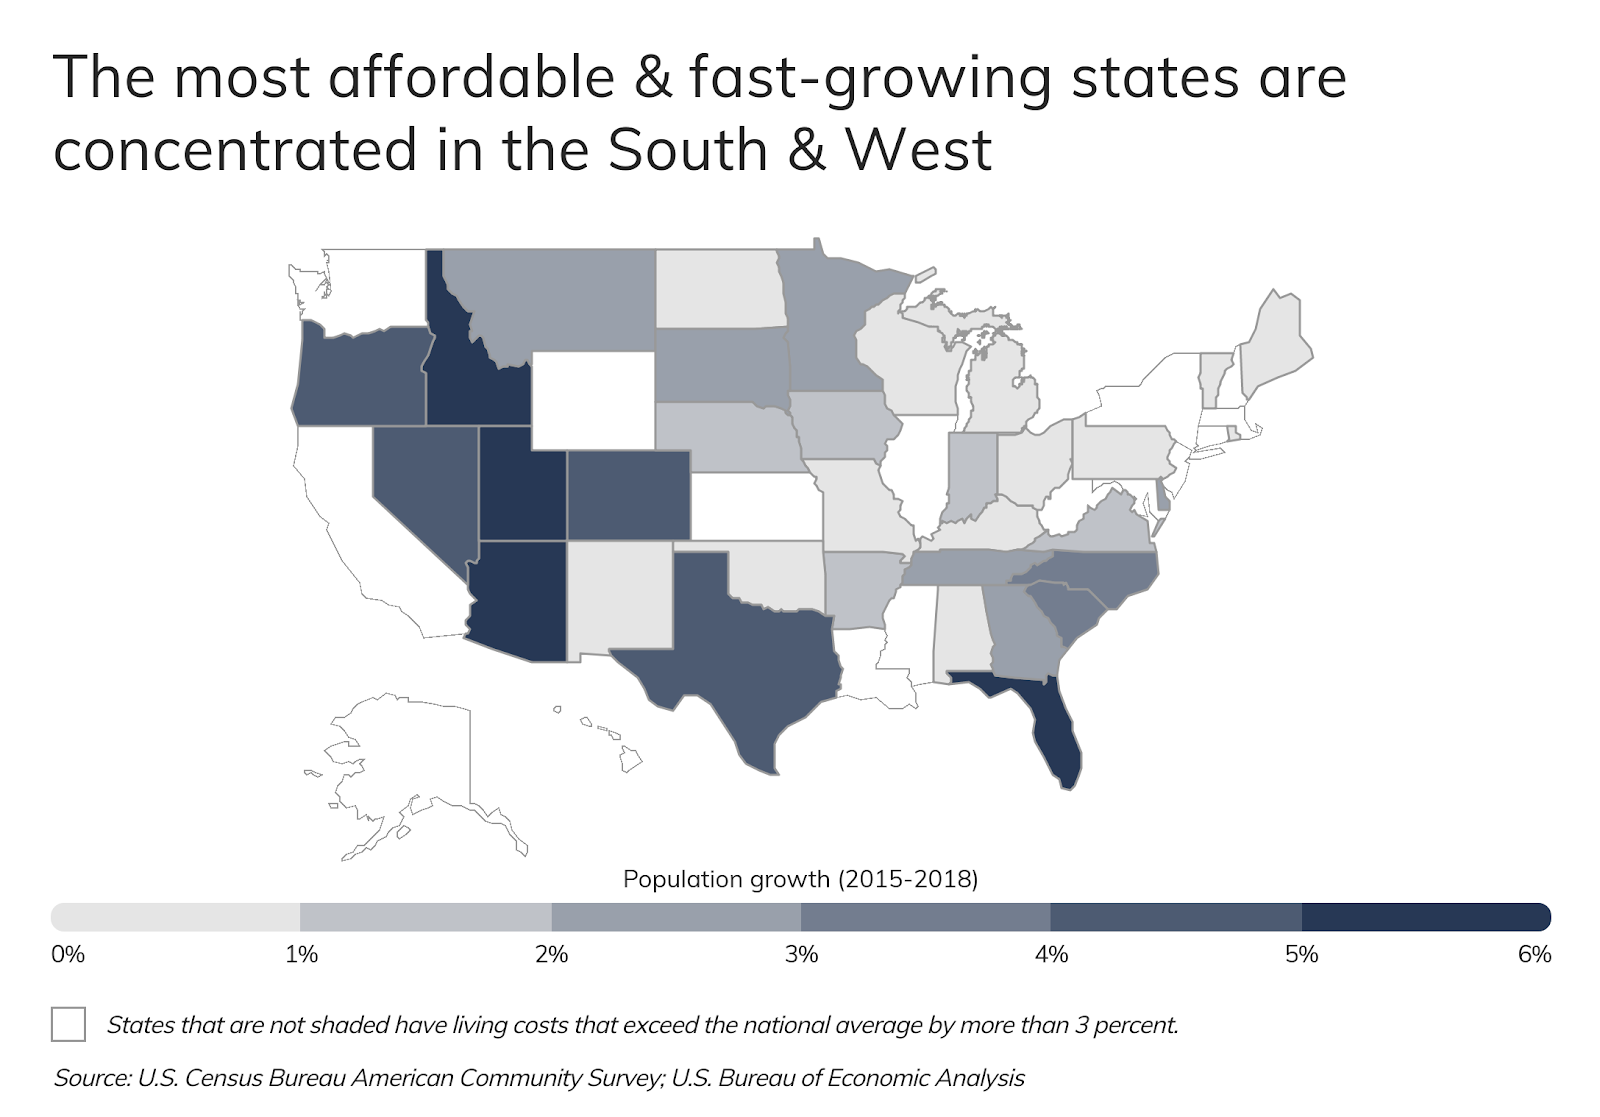
Given these trends, researchers from Roofstock, a real estate investing platform, wanted to identify locations that are likely to continue attracting new residents. To find the most affordable places in the U.S. that people have already been moving to in recent years, its researchers analyzed population statistics from the U.S. Census Bureau and cost-of-living data from the U.S. Bureau of Economic Analysis. Looking only at locations where cost of living does not exceed the national average by more than 3 percent, Roofstock identified the cities and states with the largest population increases between 2015 and 2018.
The most affordable and fast-growing states are located in the South and the West. Between 2015 and 2018, nine states in the South and West experienced population growth more than twice the national average of 1.79 percent. In fact, four states experienced population growth greater than 5 percent—Idaho, Utah, Florida, and Arizona over the same time period.
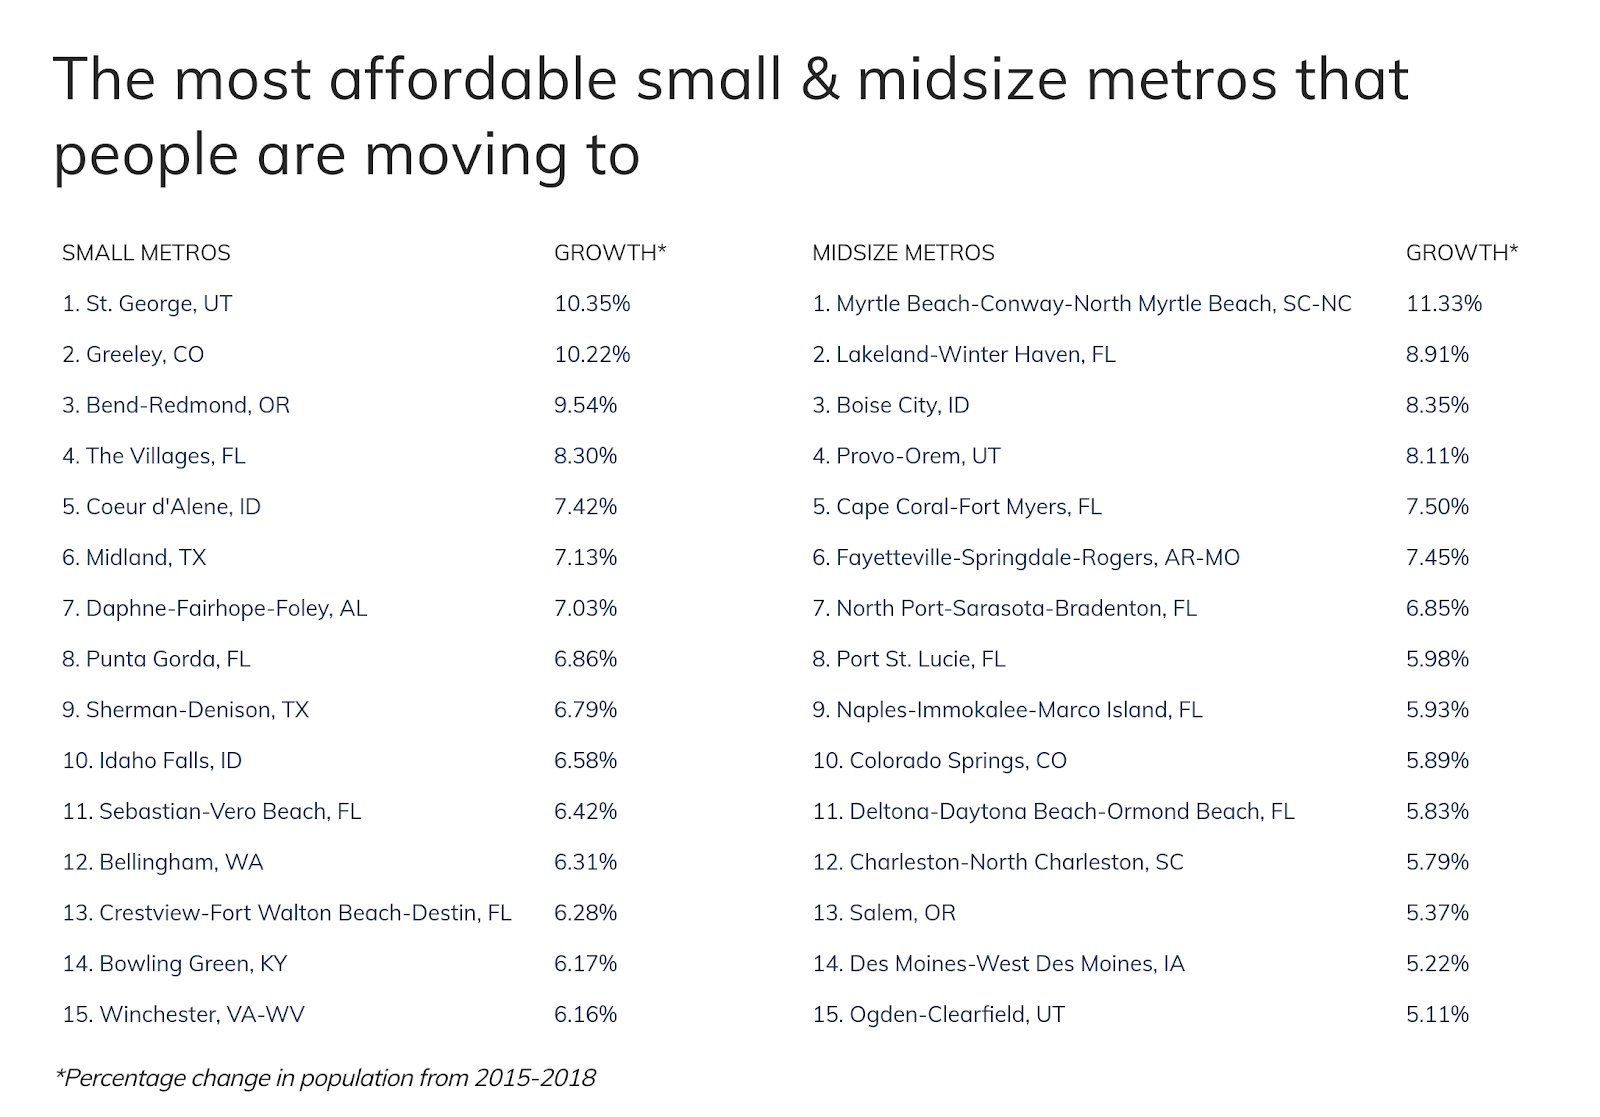
Likewise, metropolitan areas in the South and West offer lower living costs, and have been attracting large numbers of movers in recent years. Below are the most affordable metropolitan areas that people are moving to, grouped by population size: large (more than 1,000,000), midsize (350,000-999,999), and small (100,000-349,999).
The most affordable large metros that people are moving to
Photo Credit: Alamy Stock Photo
15. Columbus, OH
3-year population growth (percent): 4.20%
3-year population growth (total): 84,909
Cost of living (compared to national average): -8.1%
Median home price: $219,012
Average 2-bedroom rent: $992 per month
Photo Credit: Alamy Stock Photo
14. Atlanta-Sandy Springs-Roswell, GA
3-year population growth (percent): 4.22%
3-year population growth (total): 241,097
Cost of living (compared to national average): -2.7%
Median home price: $245,983
Average 2-bedroom rent: $1,167 per month
Photo Credit: Alamy Stock Photo
13. Salt Lake City, UT
3-year population growth (percent): 4.47%
3-year population growth (total): 52,274
Cost of living (compared to national average): -1.3%
Median home price: $391,450
Average 2-bedroom rent: $1,176 per month
Photo Credit: Alamy Stock Photo
12. Houston-The Woodlands-Sugar Land, TX
3-year population growth (percent): 5.11%
3-year population growth (total): 340,438
Cost of living (compared to national average): +1.8%
Median home price: $221,426
Average 2-bedroom rent: $1,096 per month
Photo Credit: Alamy Stock Photo
11. Las Vegas-Henderson-Paradise, NV
3-year population growth (percent): 5.53%
3-year population growth (total): 116,846
Cost of living (compared to national average): -3.2%
Median home price: $296,575
Average 2-bedroom rent: $1,080 per month
Photo Credit: Alamy Stock Photo
10. Nashville-Davidson–Murfreesboro–Franklin, TN
3-year population growth (percent): 5.56%
3-year population growth (total): 101,801
Cost of living (compared to national average): -5.1%
Median home price: $287,200
Average 2-bedroom rent: $1,136 per month
Photo Credit: Alamy Stock Photo
9. Tampa-St. Petersburg-Clearwater, FL
3-year population growth (percent): 5.63%
3-year population growth (total): 167,438
Cost of living (compared to national average): -1.0%
Median home price: $235,572
Average 2-bedroom rent: $1,206 per month
Photo Credit: Alamy Stock Photo
8. San Antonio-New Braunfels, TX
3-year population growth (percent): 5.72%
3-year population growth (total): 136,208
Cost of living (compared to national average): -6.1%
Median home price: $208,916
Average 2-bedroom rent: $1,051 per month
Photo Credit: Alamy Stock Photo
7. Jacksonville, FL
3-year population growth (percent): 5.88%
3-year population growth (total): 85,220
Cost of living (compared to national average): -4.5%
Median home price: $236,790
Average 2-bedroom rent: $1,059 per month
Photo Credit: Alamy Stock Photo
6. Charlotte-Concord-Gastonia, NC-SC
3-year population growth (percent): 5.89%
3-year population growth (total): 142,850
Cost of living (compared to national average): -5.8%
Median home price: $244,059
Average 2-bedroom rent: $1,063 per month
Photo Credit: Alamy Stock Photo
5. Dallas-Fort Worth-Arlington, TX
3-year population growth (percent): 6.17%
3-year population growth (total): 438,206
Cost of living (compared to national average): +0.7%
Median home price: $257,309
Average 2-bedroom rent: $1,314 per month
Photo Credit: Alamy Stock Photo
4. Phoenix-Mesa-Scottsdale, AZ
3-year population growth (percent): 6.20%
3-year population growth (total): 283,431
Cost of living (compared to national average): -1.9%
Median home price: $300,740
Average 2-bedroom rent: $1,173 per month
Photo Credit: Alamy Stock Photo
3. Raleigh, NC
3-year population growth (percent): 6.99%
3-year population growth (total): 88,972
Cost of living (compared to national average): -3.4%
Median home price: $290,686
Average 2-bedroom rent: $1,163 per month
Photo Credit: Alamy Stock Photo
2. Orlando-Kissimmee-Sanford, FL
3-year population growth (percent): 7.78%
3-year population growth (total): 185,824
Cost of living (compared to national average): -1.3%
Median home price: $263,183
Average 2-bedroom rent: $1,248 per month
Photo Credit: Alamy Stock Photo
1. Austin-Round Rock, TX
3-year population growth (percent): 8.37%
3-year population growth (total): 167,456
Cost of living (compared to national average): +0.2%
To find the most affordable metropolitan areas that people are moving to, researchers identified locations with the largest population increases between 2015 and 2018. Metropolitan areas with a negative or no change in population were filtered out. Additionally, metropolitan areas with a cost of living that exceeds the national average by more than 3 percent were also filtered out. Only locations with 100,000 residents or more were included.
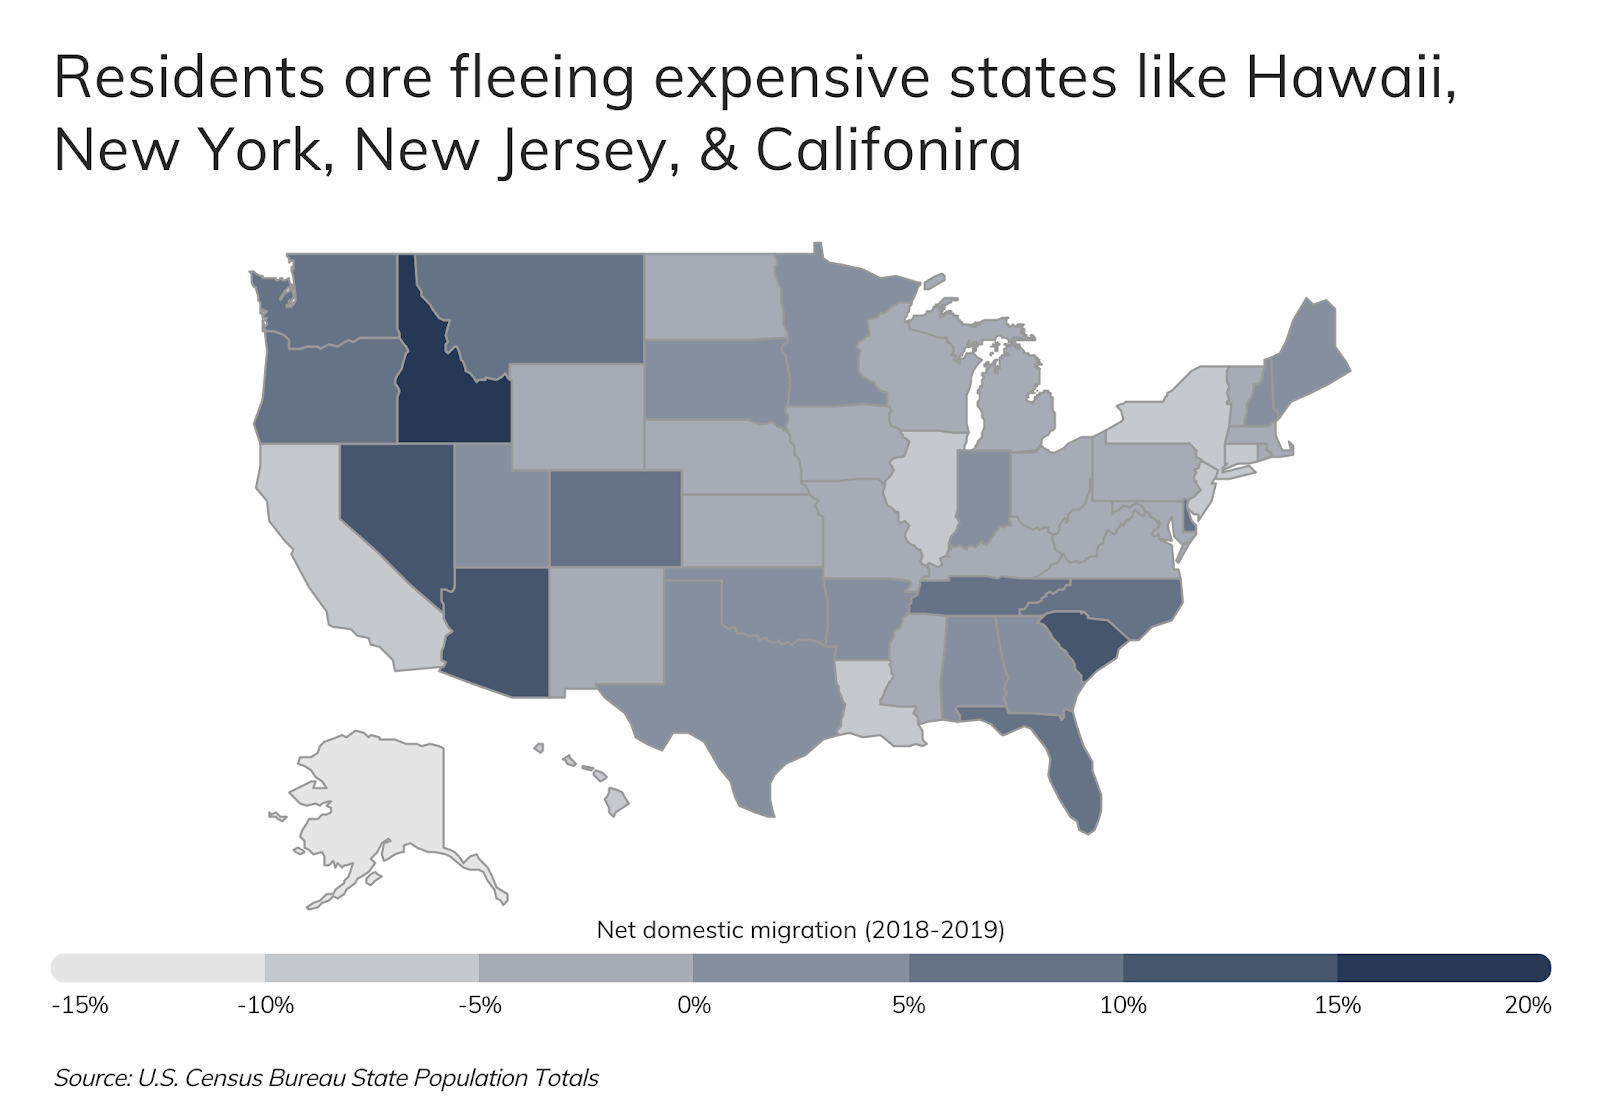
While overall population changes can be partially attributed to birth rates, net domestic migration trends further underscore the rising appeal of the South and West. Data from the Census Bureau shows that between 2018 and 2019, the Northeast, Midwest, and California suffered significant population losses due to residents moving out-of-state.
New York experienced a net domestic migration of -9.3 percent, and California’s net domestic migration rate was -5.2 percent. By contrast, many Southern and Western states are growing quickly, with South Carolina, Arizona, Nevada, and Idaho experiencing double-digit net domestic migration rates.
With a record number of workers no longer physically tethered to their jobs, a wide range of more affordable locations will continue to attract residents away from expensive Northeast and California cities.

 Photo Credit: Alamy Stock Photo