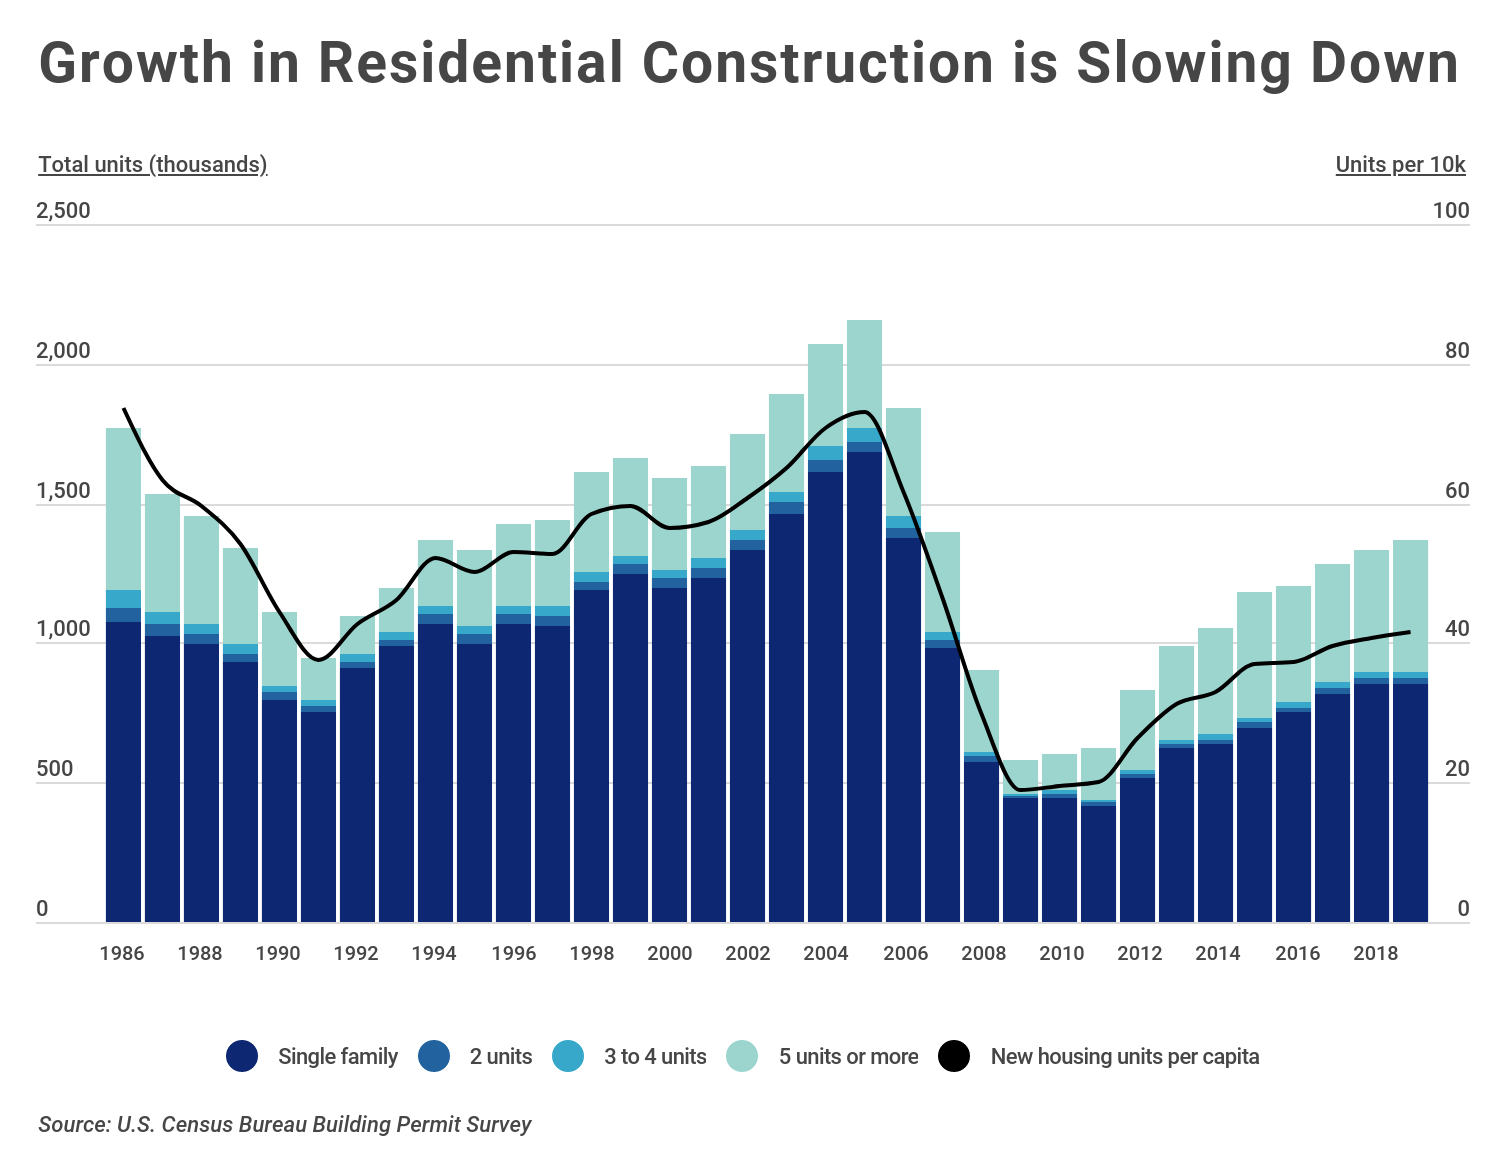
New housing construction in the U.S. is slowing down, which isn’t good for families already struggling to afford their first home. Even though multi-family dwellings have accounted for the lion’s share of new home construction growth since the recession, the shift away from single-family homes has failed to lower prices. Data from the Department of Housing and Urban Development shows that the median sale price for new homes in the U.S. reached a record high of $348,200 at the start of 2020.
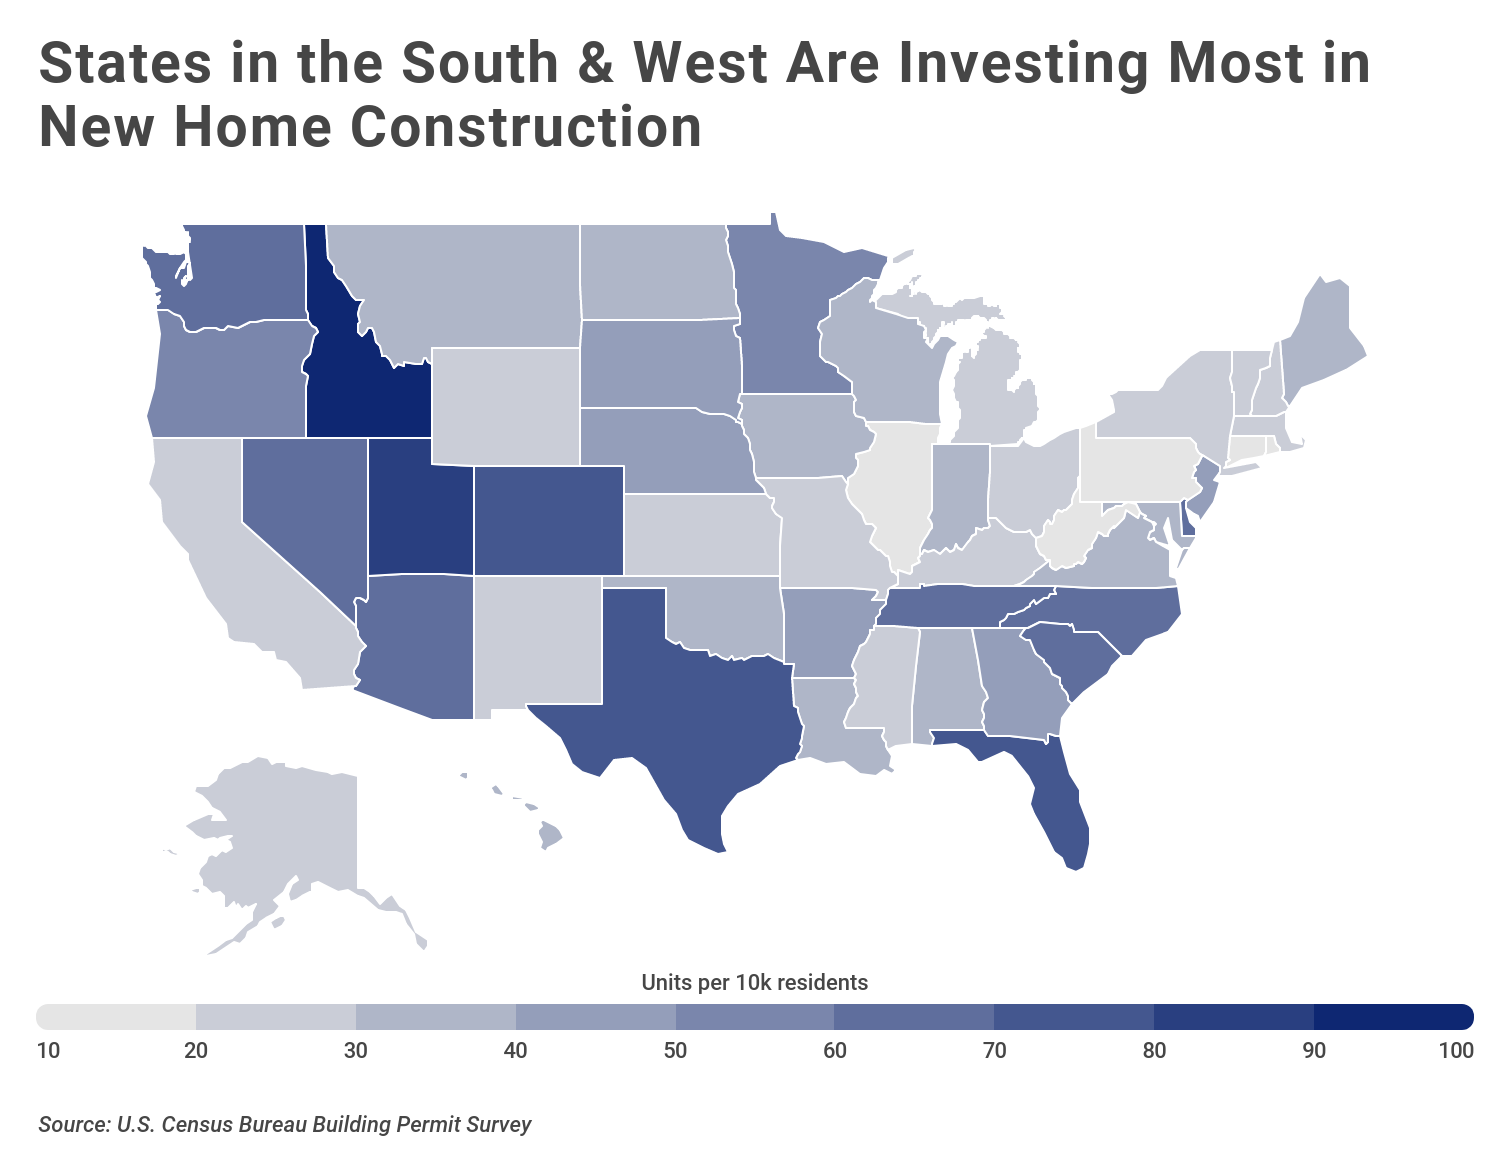
While at the national level, investment in new housing largely ebbs and flows with the broader economy, at the state and local level, it is tightly coupled with population growth. States in the South and West, which have experienced above-average population growth in recent years, are investing the most in new housing. New residential construction per capita in Idaho and Utah, in particular, exceed the national rate of 41.9 units per 10,000 residents by more than 100 percent. By contrast, states in the Northeast—many of which have seen their populations stagnate or decline—are constructing the fewest new homes per capita.
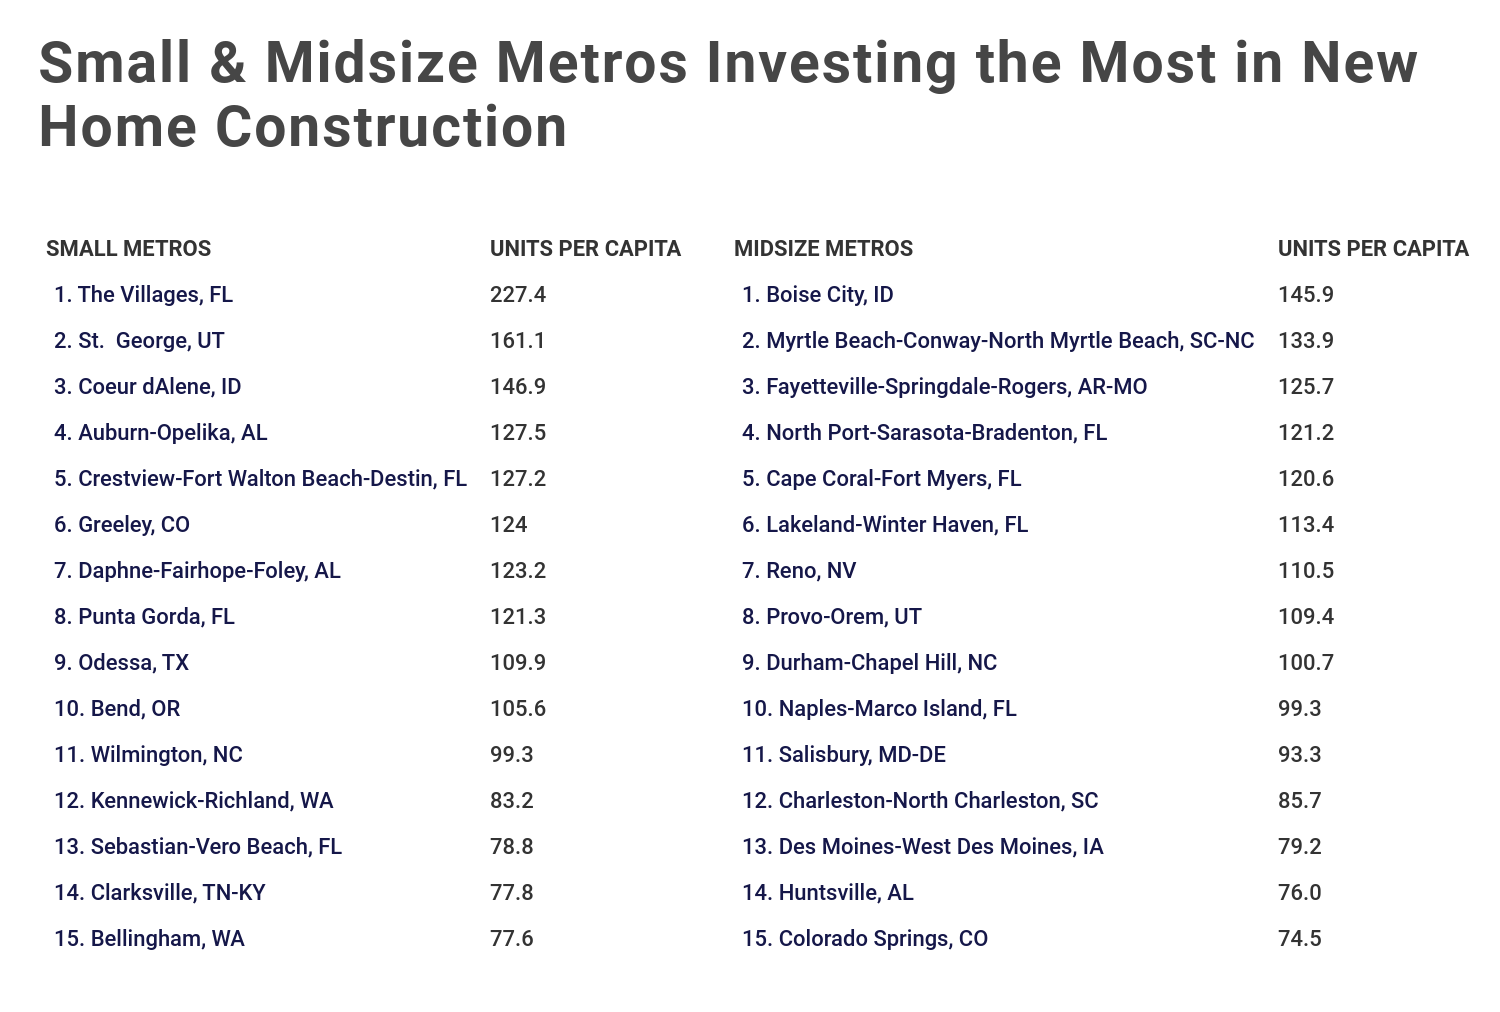
To find which metropolitan areas are investing the most in new housing, researchers at Construction Coverage analyzed building permit data from the U.S. Census Bureau and home price data from Zillow. For each metro, the researchers calculated the number of new housing units per 10,000 residents. They also looked at the share of new housing units that are multi-family, the total value of new home construction, the median home value, and the five-year population growth. Only metros with at least 100,000 residents were included. Additionally, metros were grouped into cohorts based on population size: large metros (1,000,000 residents or more), midsize metros (350,000-999,999 residents), and small metros (less than 350,000 residents).
Similar to the statewide trends, locations in the South and West with above-average population growth have the highest rates of new home construction. Here are the metropolitan areas investing the most in new housing.
Large Metros Investing the Most in New Housing
Photo Credit: Alamy Stock Photo
15. Richmond, VA
New housing units per 10k: 63.7
Total new housing units: 8,321
Share of new housing units that are multi-family: 46.4%
Total value of new housing units (millions): $1,202
Median home value: $242,040
5-year population growth: 4.4%
Photo Credit: Alamy Stock Photo
14. Denver-Aurora-Lakewood, CO
New housing units per 10k: 65.7
Total new housing units: 19,278
Share of new housing units that are multi-family: 42.7%
Total value of new housing units (millions): $4,302
Median home value: $430,399
5-year population growth: 8.7%
Photo Credit: Alamy Stock Photo
13. Seattle-Tacoma-Bellevue, WA
New housing units per 10k: 67.5
Total new housing units: 26,584
Share of new housing units that are multi-family: 67.1%
Total value of new housing units (millions): $5,553
Median home value: $515,535
5-year population growth: 9.1%
Photo Credit: Alamy Stock Photo
12. Portland-Vancouver-Hillsboro, OR-WA
New housing units per 10k: 67.6
Total new housing units: 16,756
Share of new housing units that are multi-family: 54.4%
Total value of new housing units (millions): $3,347
Median home value: $412,306
5-year population growth: 7.1%
Photo Credit: Alamy Stock Photo
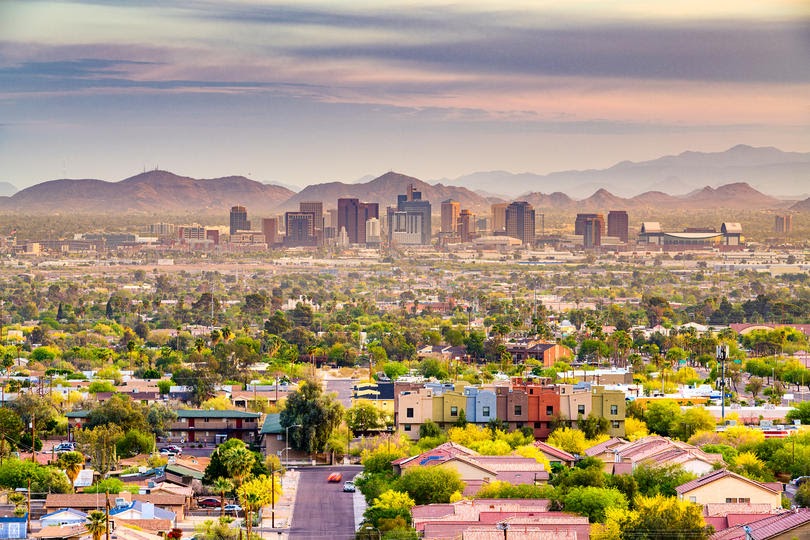
11. Phoenix-Mesa-Chandler, AZ
New housing units per 10k: 72.9
Total new housing units: 35,400
Share of new housing units that are multi-family: 29.6%
Total value of new housing units (millions): $8,142
Median home value: $277,848
5-year population growth: 10.4%
Photo Credit: Alamy Stock Photo
10. Tampa-St. Petersburg-Clearwater, FL
New housing units per 10k: 75.0
Total new housing units: 23,558
Share of new housing units that are multi-family: 37.7%
Total value of new housing units (millions): $5,078
Median home value: $224,303
5-year population growth: 9.5%
Photo Credit: Alamy Stock Photo
9. Dallas-Fort Worth-Arlington, TX
New housing units per 10k: 83.0
Total new housing units: 62,563
Share of new housing units that are multi-family: 43.8%
Total value of new housing units (millions): $12,706
Median home value: $250,865
5-year population growth: 10.7%
Photo Credit: Alamy Stock Photo
8. Salt Lake City, UT
New housing units per 10k: 86.8
Total new housing units: 10,610
Share of new housing units that are multi-family: 55.0%
Total value of new housing units (millions): $2,020
Median home value: $372,549
5-year population growth: 7.2%
Photo Credit: Alamy Stock Photo
7. Houston-The Woodlands-Sugar Land, TX
New housing units per 10k: 88.3
Total new housing units: 61,770
Share of new housing units that are multi-family: 35.5%
Total value of new housing units (millions): $9,538
Median home value: $214,883
5-year population growth: 10.8%
Photo Credit: Alamy Stock Photo
6. Charlotte-Concord-Gastonia, NC-SC
New housing units per 10k: 90.7
Total new housing units: 23,293
Share of new housing units that are multi-family: 35.6%
Total value of new housing units (millions): $4,761
Median home value: $230,620
5-year population growth: 10.0%
Photo Credit: Alamy Stock Photo
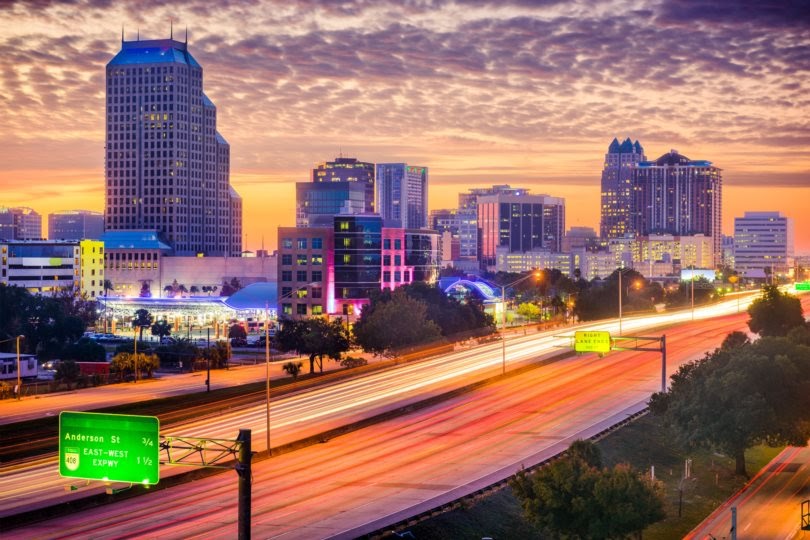
5. Orlando-Kissimmee-Sanford, FL
New housing units per 10k: 96.3
Total new housing units: 24,778
Share of new housing units that are multi-family: 39.4%
Total value of new housing units (millions): $5,236
Median home value: $251,018
5-year population growth: 13.5%
Photo Credit: Alamy Stock Photo
4. Jacksonville, FL
New housing units per 10k: 96.9
Total new housing units: 14,868
Share of new housing units that are multi-family: 23.9%
Total value of new housing units (millions): $3,111
Median home value: $222,232
5-year population growth: 10.0%
Photo Credit: Alamy Stock Photo
3. Raleigh-Cary, NC
New housing units per 10k: 109.9
Total new housing units: 14,972
Share of new housing units that are multi-family: 21.9%
Total value of new housing units (millions): $2,877
Median home value: $279,024
5-year population growth: 12.2%
Photo Credit: Alamy Stock Photo
2. Nashville-Davidson–Murfreesboro–Franklin, TN
New housing units per 10k: 113.1
Total new housing units: 21,845
Share of new housing units that are multi-family: 38.5%
Total value of new housing units (millions): $4,333
Median home value: $274,729
5-year population growth: 9.9%
Photo Credit: Alamy Stock Photo
1. Austin-Round Rock-Georgetown, TX
New housing units per 10k: 147.7
Total new housing units: 32,025
Share of new housing units that are multi-family: 43.3%
Total value of new housing units (millions): $5,802
Median home value: $331,525
5-year population growth: 15.2%
Methodology & Detailed Findings
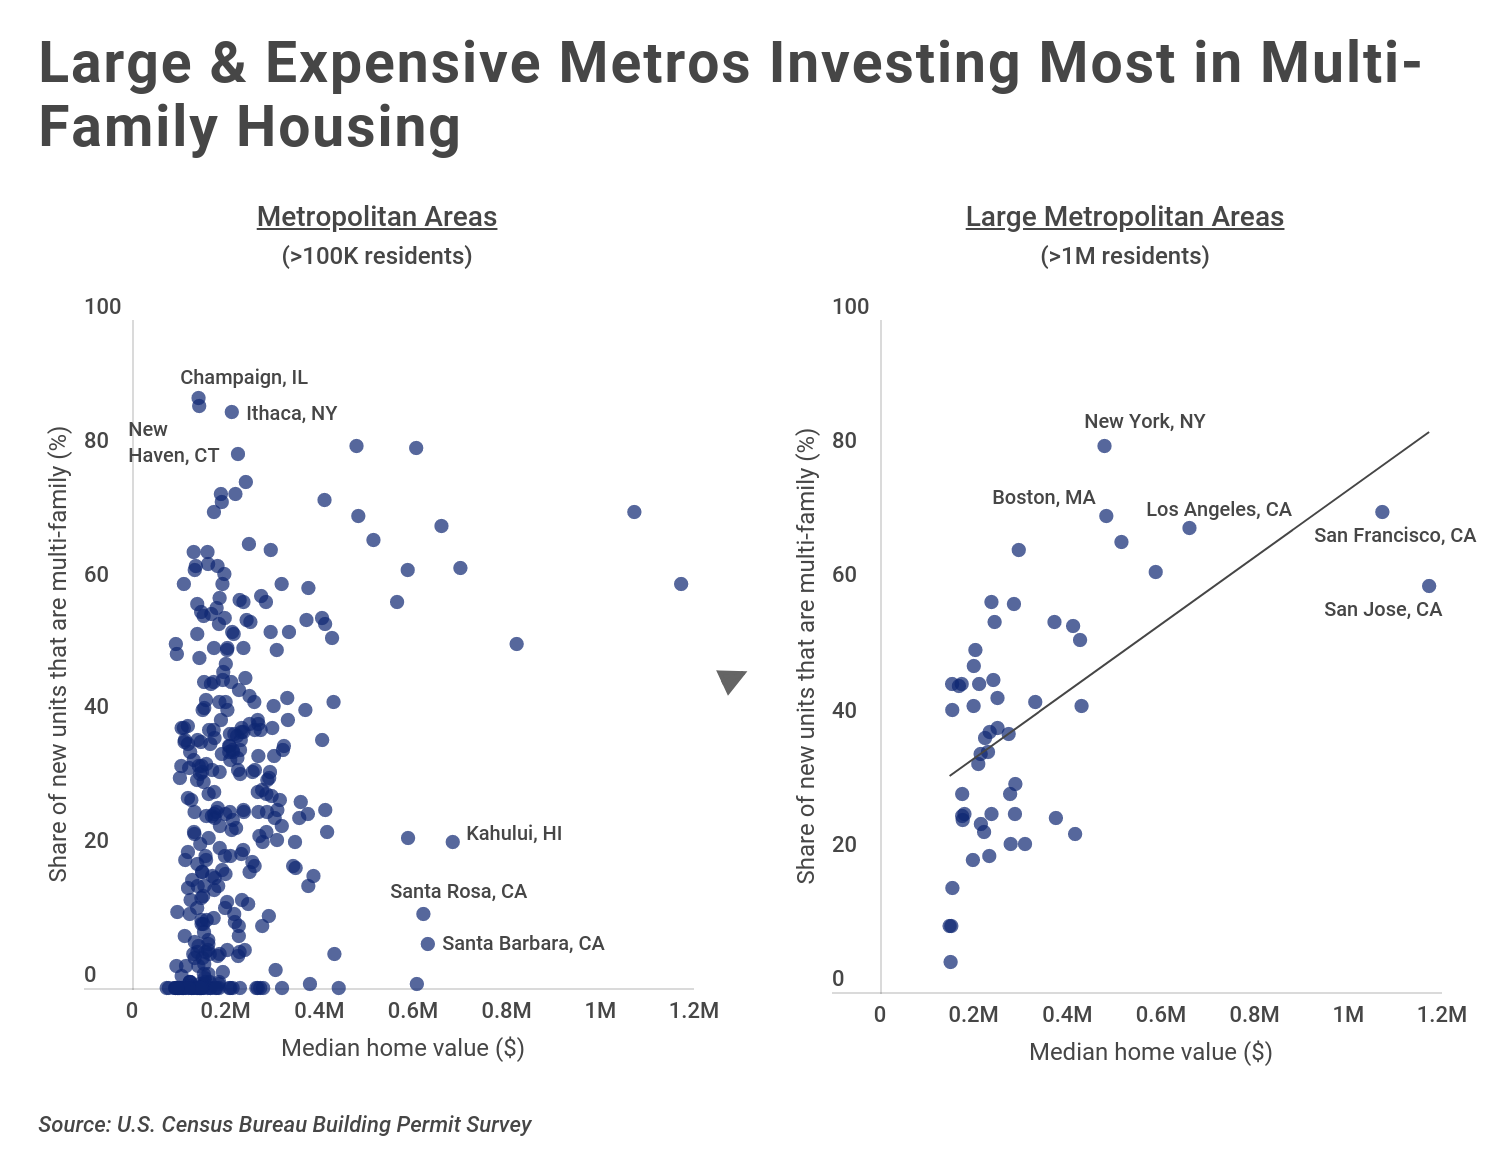
Across all metros, there is no correlation between home price and the proportion of multi-family home construction. However, looking only at metropolitan areas with over 1 million residents, there is a loose positive correlation. As a result of space constraints and skyrocketing prices for single-family homes, America’s largest and most expensive metros such as Los Angeles, New York, Boston, San Francisco, and Seattle are investing heavily in multi-family dwellings.
Statistics on new housing units and new housing unit valuation are from the U.S. Census Bureau Building Permits Survey. The survey includes new single- and multi-unit housing projects authorized by building permits at the metropolitan, state, and national levels. This analysis used annual data from 2019—the most recent full year available.
For each metropolitan area, the number of new housing units was divided by the total resident population to yield the new housing units per 10,000 residents statistic. This statistic was used to rank the metros. In the event of a tie, the location with the larger number of total new housing units was ranked higher.

 Photo Credit: Alamy Stock Photo